3
Observing the Relationship between People's Behaviour and Spatial Layout
Observing the Relationship between People's Behaviour and Spatial Layout
3:Observing the Relationship between People's Behaviour and Spatial Layout
What happens when the stools are moved around?
― A small experiment and observation study
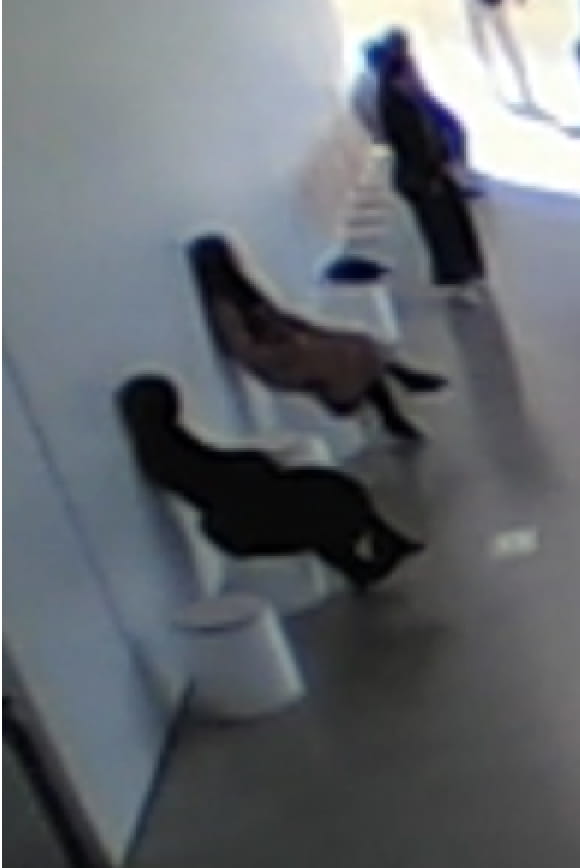
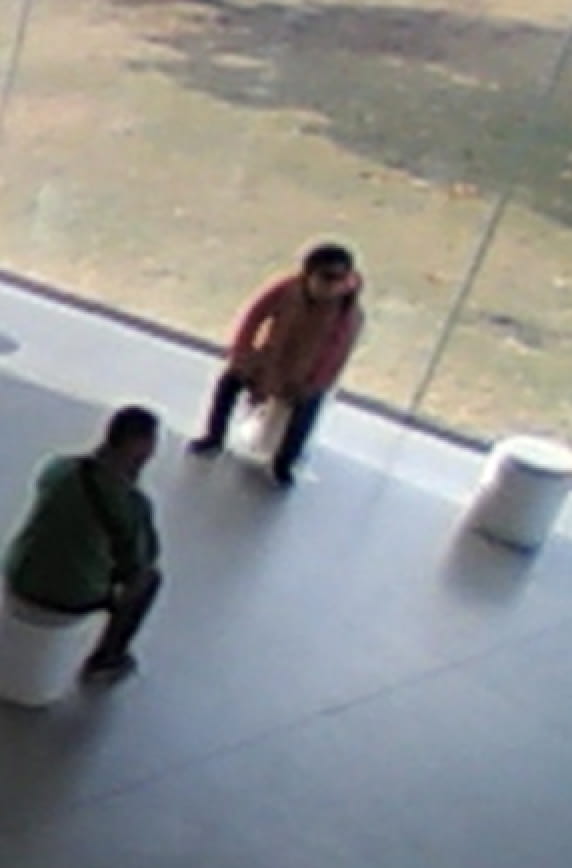
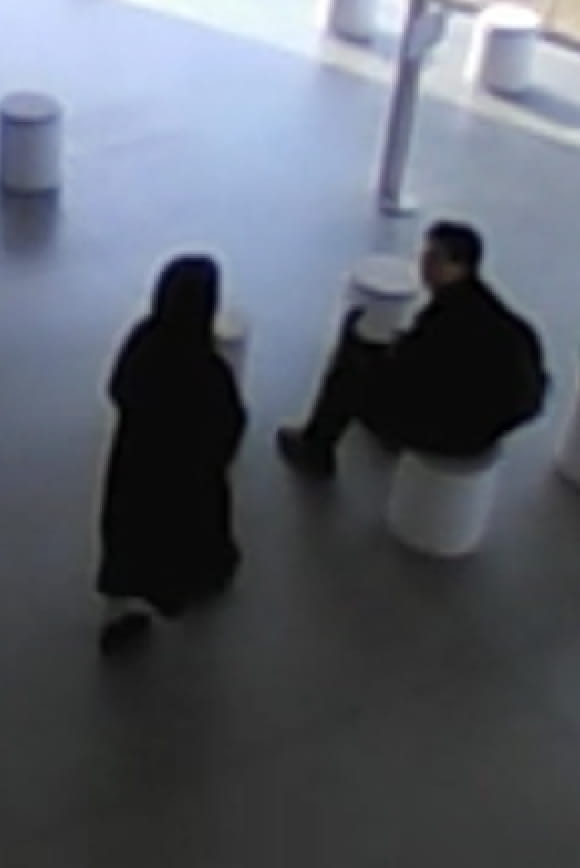
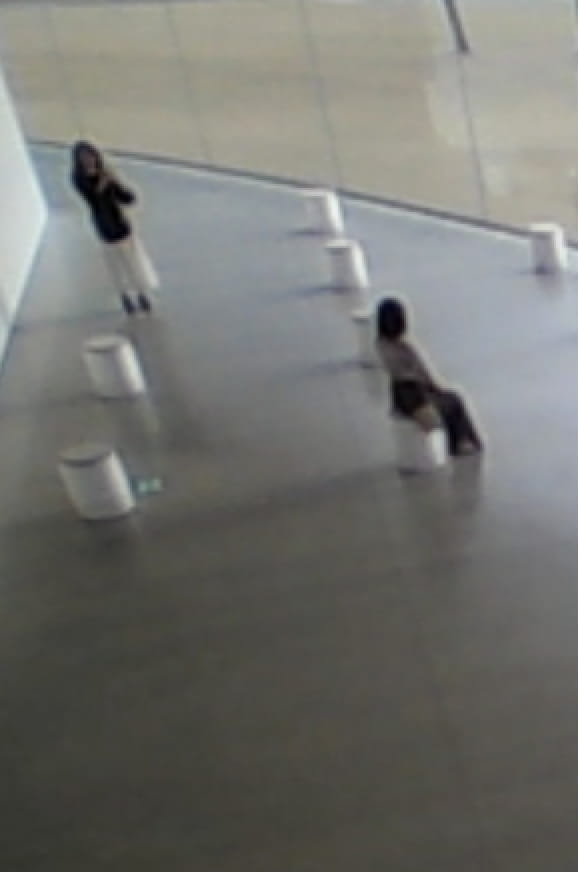
A person walks in. That is the beginning of the story. They then see the stools, choose one and sit on it. They look around and find something that attracts them... Being in the company of other visitors, ‘people-watching’, then perhaps an unplanned small communication with someone... Social life takes place in places like this.
Here in 21st Century Museum of Contemporary Art, Kanazawa an experiment is taking place: to change the spatial layout of a part of the circulation space - by moving stools – and then seeing how people’s behaviour is affected. The research questions include: Does the layout of stools affect how people move through the gallery and where they stop? In which locations do people tend to rest longer? When people stand or sit in conversational groups, what size of space do they typically occupy? What else do people do in the museum other than look at exhibits? This is a small experiment, but it might reveal some important results. It may even be possible to show whether the museum acts as a social space, exhibiting the characteristics of a village or small town.
What happens when the stools are moved around?A small experiment and observation study
What happens when the stools are moved around? A small experiment and observation study
It’s a normal day in the life of the city.
Some people are sitting down.
Others are walking by.
Which seat do you sit in, and in which direction
do you choose to face?
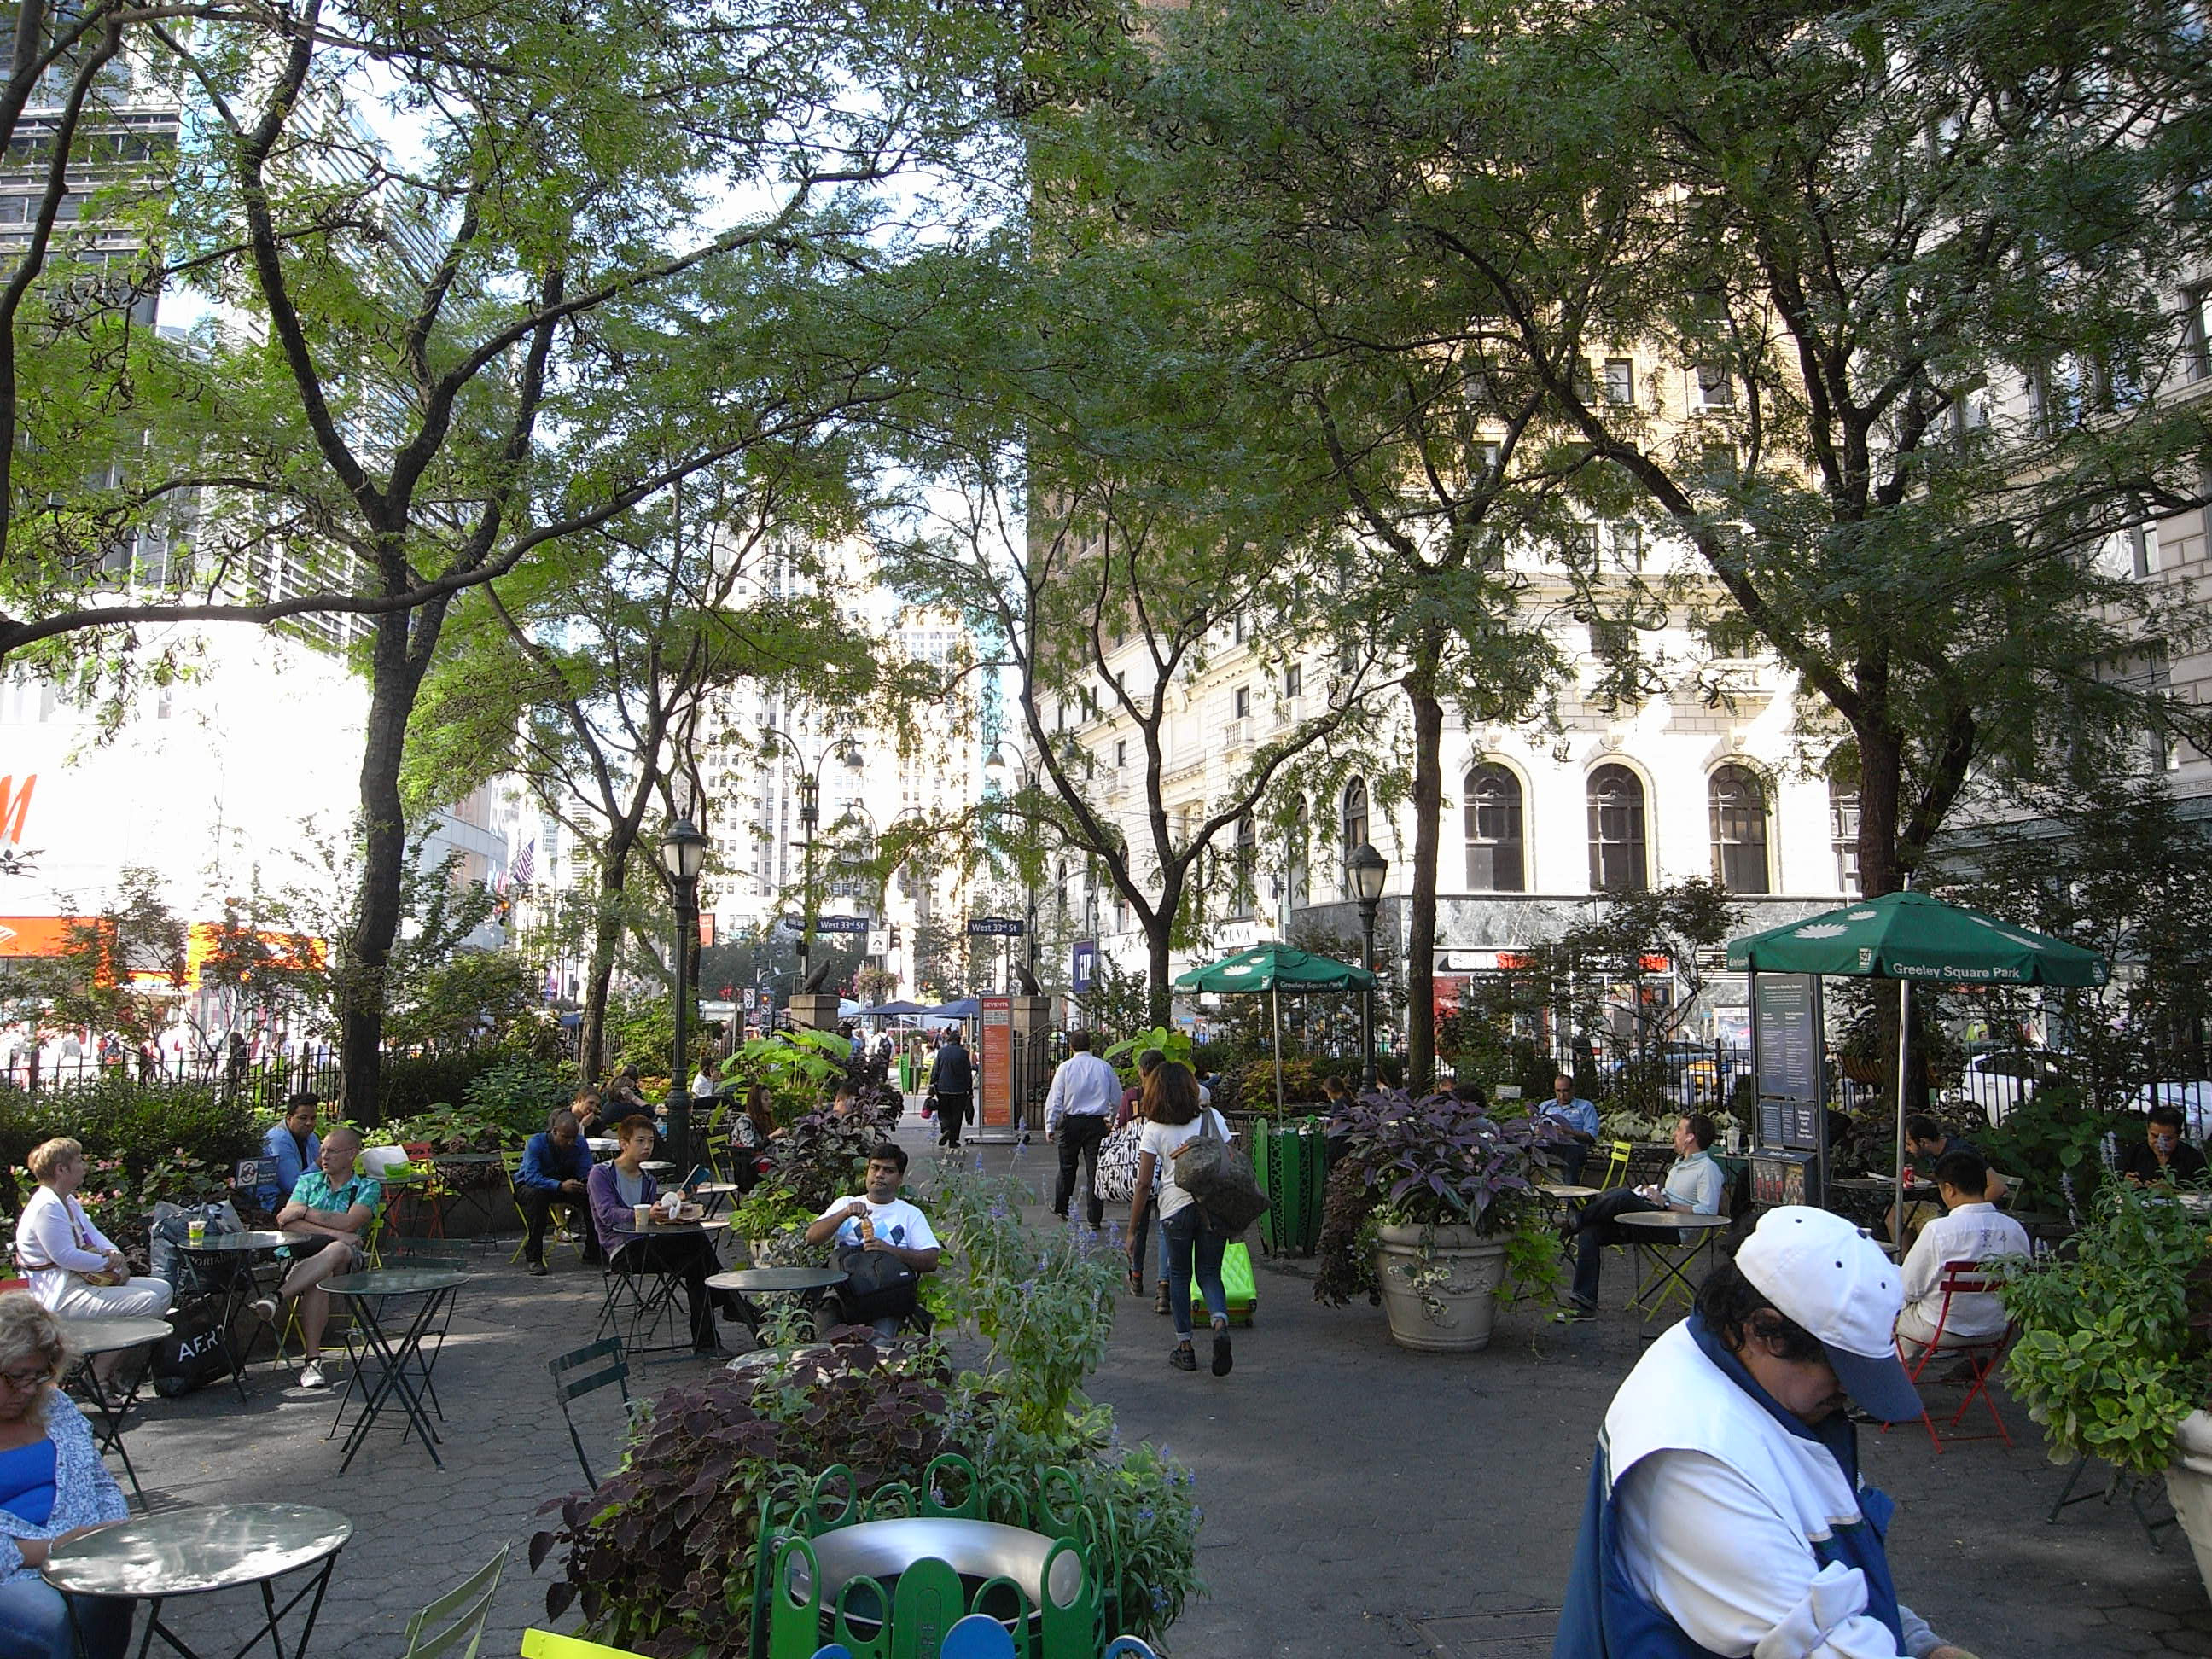
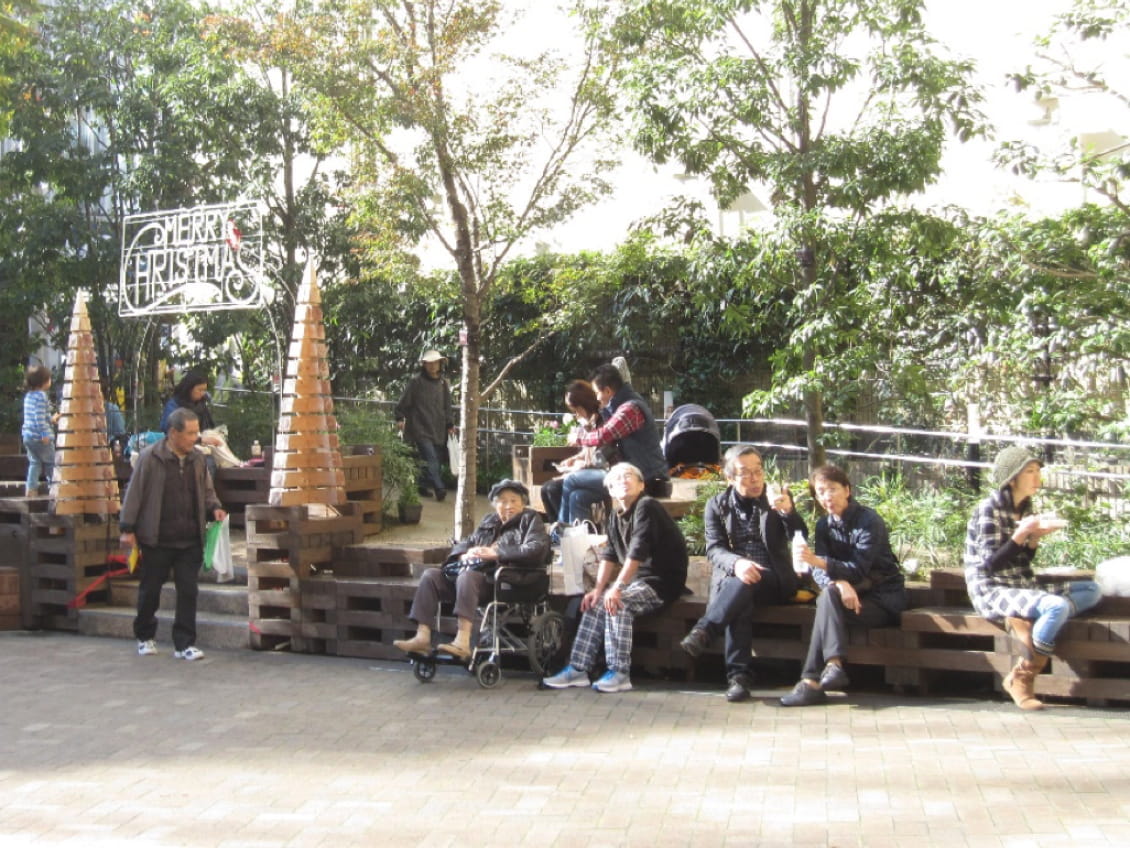
Someone alone, taking a break. A couple enjoying each other’s company. A family group having fun
Does the way that people behave in public spaces - where they choose to sit, or stand or talk - vary according to their age or the size of group they are in?
And how is people’s behaviour influenced by the location of seats and the layout of the places in which they are placed?
Why are some seats hardly ever used?
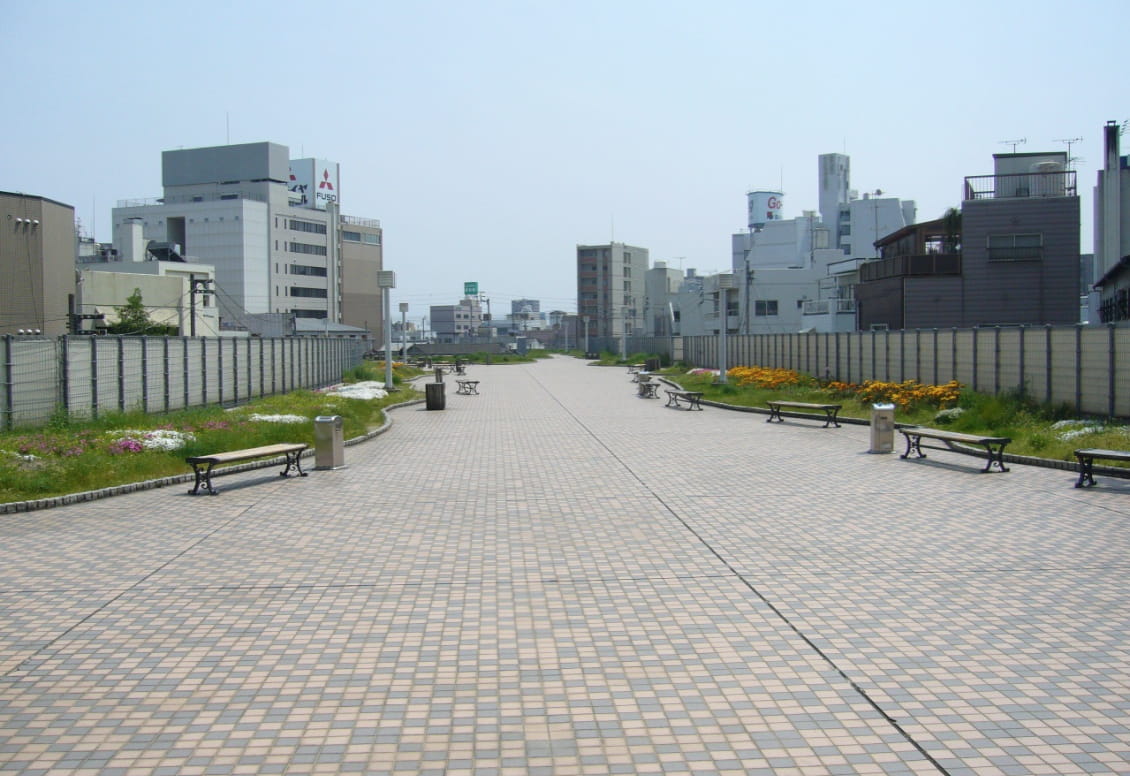
What is the best arrangement of seats for them to be used comfortably by a wide variety of people in a way that encourages many different kinds of behaviour and interaction?
So far, we have talked about the design of public spaces and the behavioural characteristics of people in them, with a focus on western urban design experts. But we can see that there is no clear evidence about layout and behaviour.
Nor, in particular, any agreement on how to create the most suitable arrangement for the behavioural outcome that is intended.
Which brings us to... An experiment with 30 moveable seats.
Responsive Environments, Paul Murrainほか(著)佐藤圭二(訳)1985(原著)2011(和訳版)
Here is the first experimental layout:
8 seats in 4 groups of 2 by the window. 6 seats by the wall. 16 seats in 4 groups of 4 in the space between the circulation routes.
Which is used most often?
Does the way that a stool is used - for example, looking outside, taking a rest or talking to someone - vary from location to location?
Was your behaviour predicted by any chance?Nearly real-time: today’s data
Was your behaviour predicted by any chance? Nearly real-time: today’s data
Let’s collect data on what people do.
In many previous studies of this kind, observers have collected data by hand and then coded it into databases by hand.
In this experiment, however, we are trying to develop a new research method by using technology to do these tasks automatically.
Image recognition technology has been developing rapidly in recent years so that data on visitor movement paths and stationary behaviour patterns (standing/sitting location and dwell time) can now be obtained by automatic detection and tracking techniques, including deep learning methods.
We aim to generate a rich interaction between a) new technologies - including continuous sensing and big - data analysis - and b) expert insights. In doing so, we aim to create a body of new knowledge.
We will change the layout of the stools every few weeks in order to record any differences in the way that people behave.
At the same time we will use Space Syntax techniques to analyse the spatial characteristics of the new layout and investigate the links between spatial layout and human behaviour.
Our interest is less in the ‘quantity’ of visitors and more in the ‘quality’ of their behaviour such as the ways that people communicate with each other and experience the architecture of the building. We will try to investigate these issues on the basis of the evidence we gather.
The result of the experiment will be exhibited at a later date.Please visit us again!
Was your behaviour predicted by any chance?
― Nearly real-time: today’s data
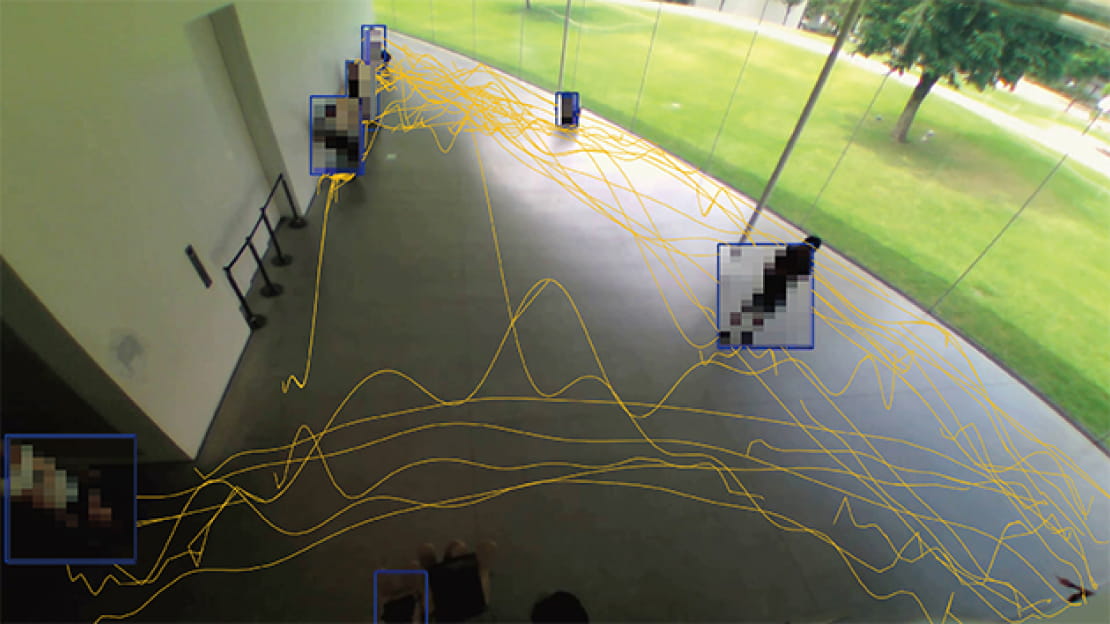
No, certainly not! The research does not focus on the behaviour of individual people*. Instead, it tries to investigate ‘phenomena’ seen in the patterns of many people. However, you might find a movement trace and think, “That might be mine!”.
Although information on human behaviour patterns have mainly been collected ‘manually’ by observers based on site, this exhibition tries to develop new “remote” techniques. The rapid development of data science technologies, such as machine learning, allows us to recognise different ‘objects’ quickly and relatively precisely. For example, a computer can learn the features of ‘a human figure’ in a video image and then use that knowledge to find ‘a human figure’ in a new image. Utilising the data collected by this technique, and then correlating this with Space Syntax spatial measures, it will be possible, for example, to discuss the best placement of seats for resting throughout the museum
Aims of the experimental survey
Aims of the experimental survey
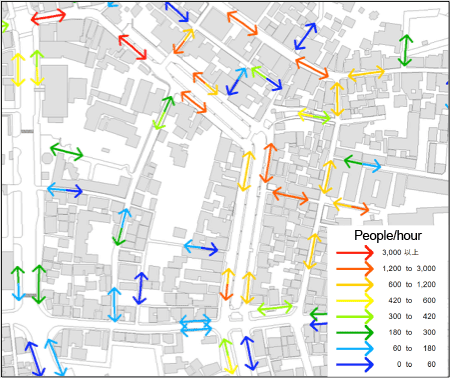
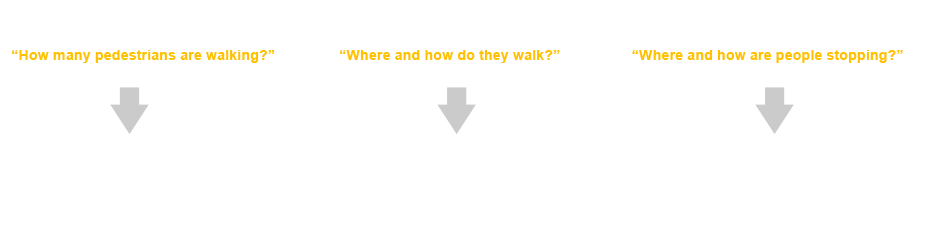
“How many pedestrians are walking?”
“Where and how do they walk?”
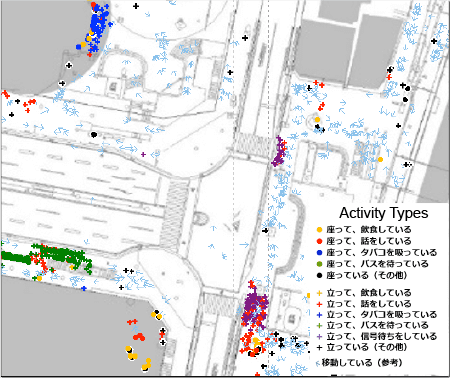
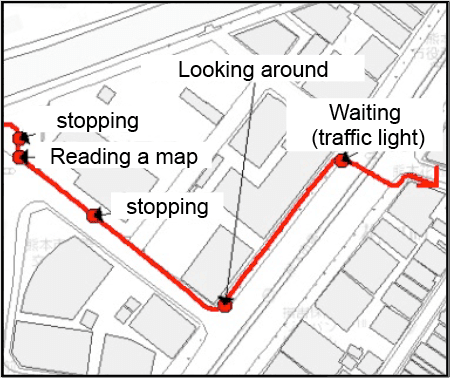
“Where and how people are stopping?”
1.To investigate the possibility of using video analysis technology to understand human behaviour in public spaces
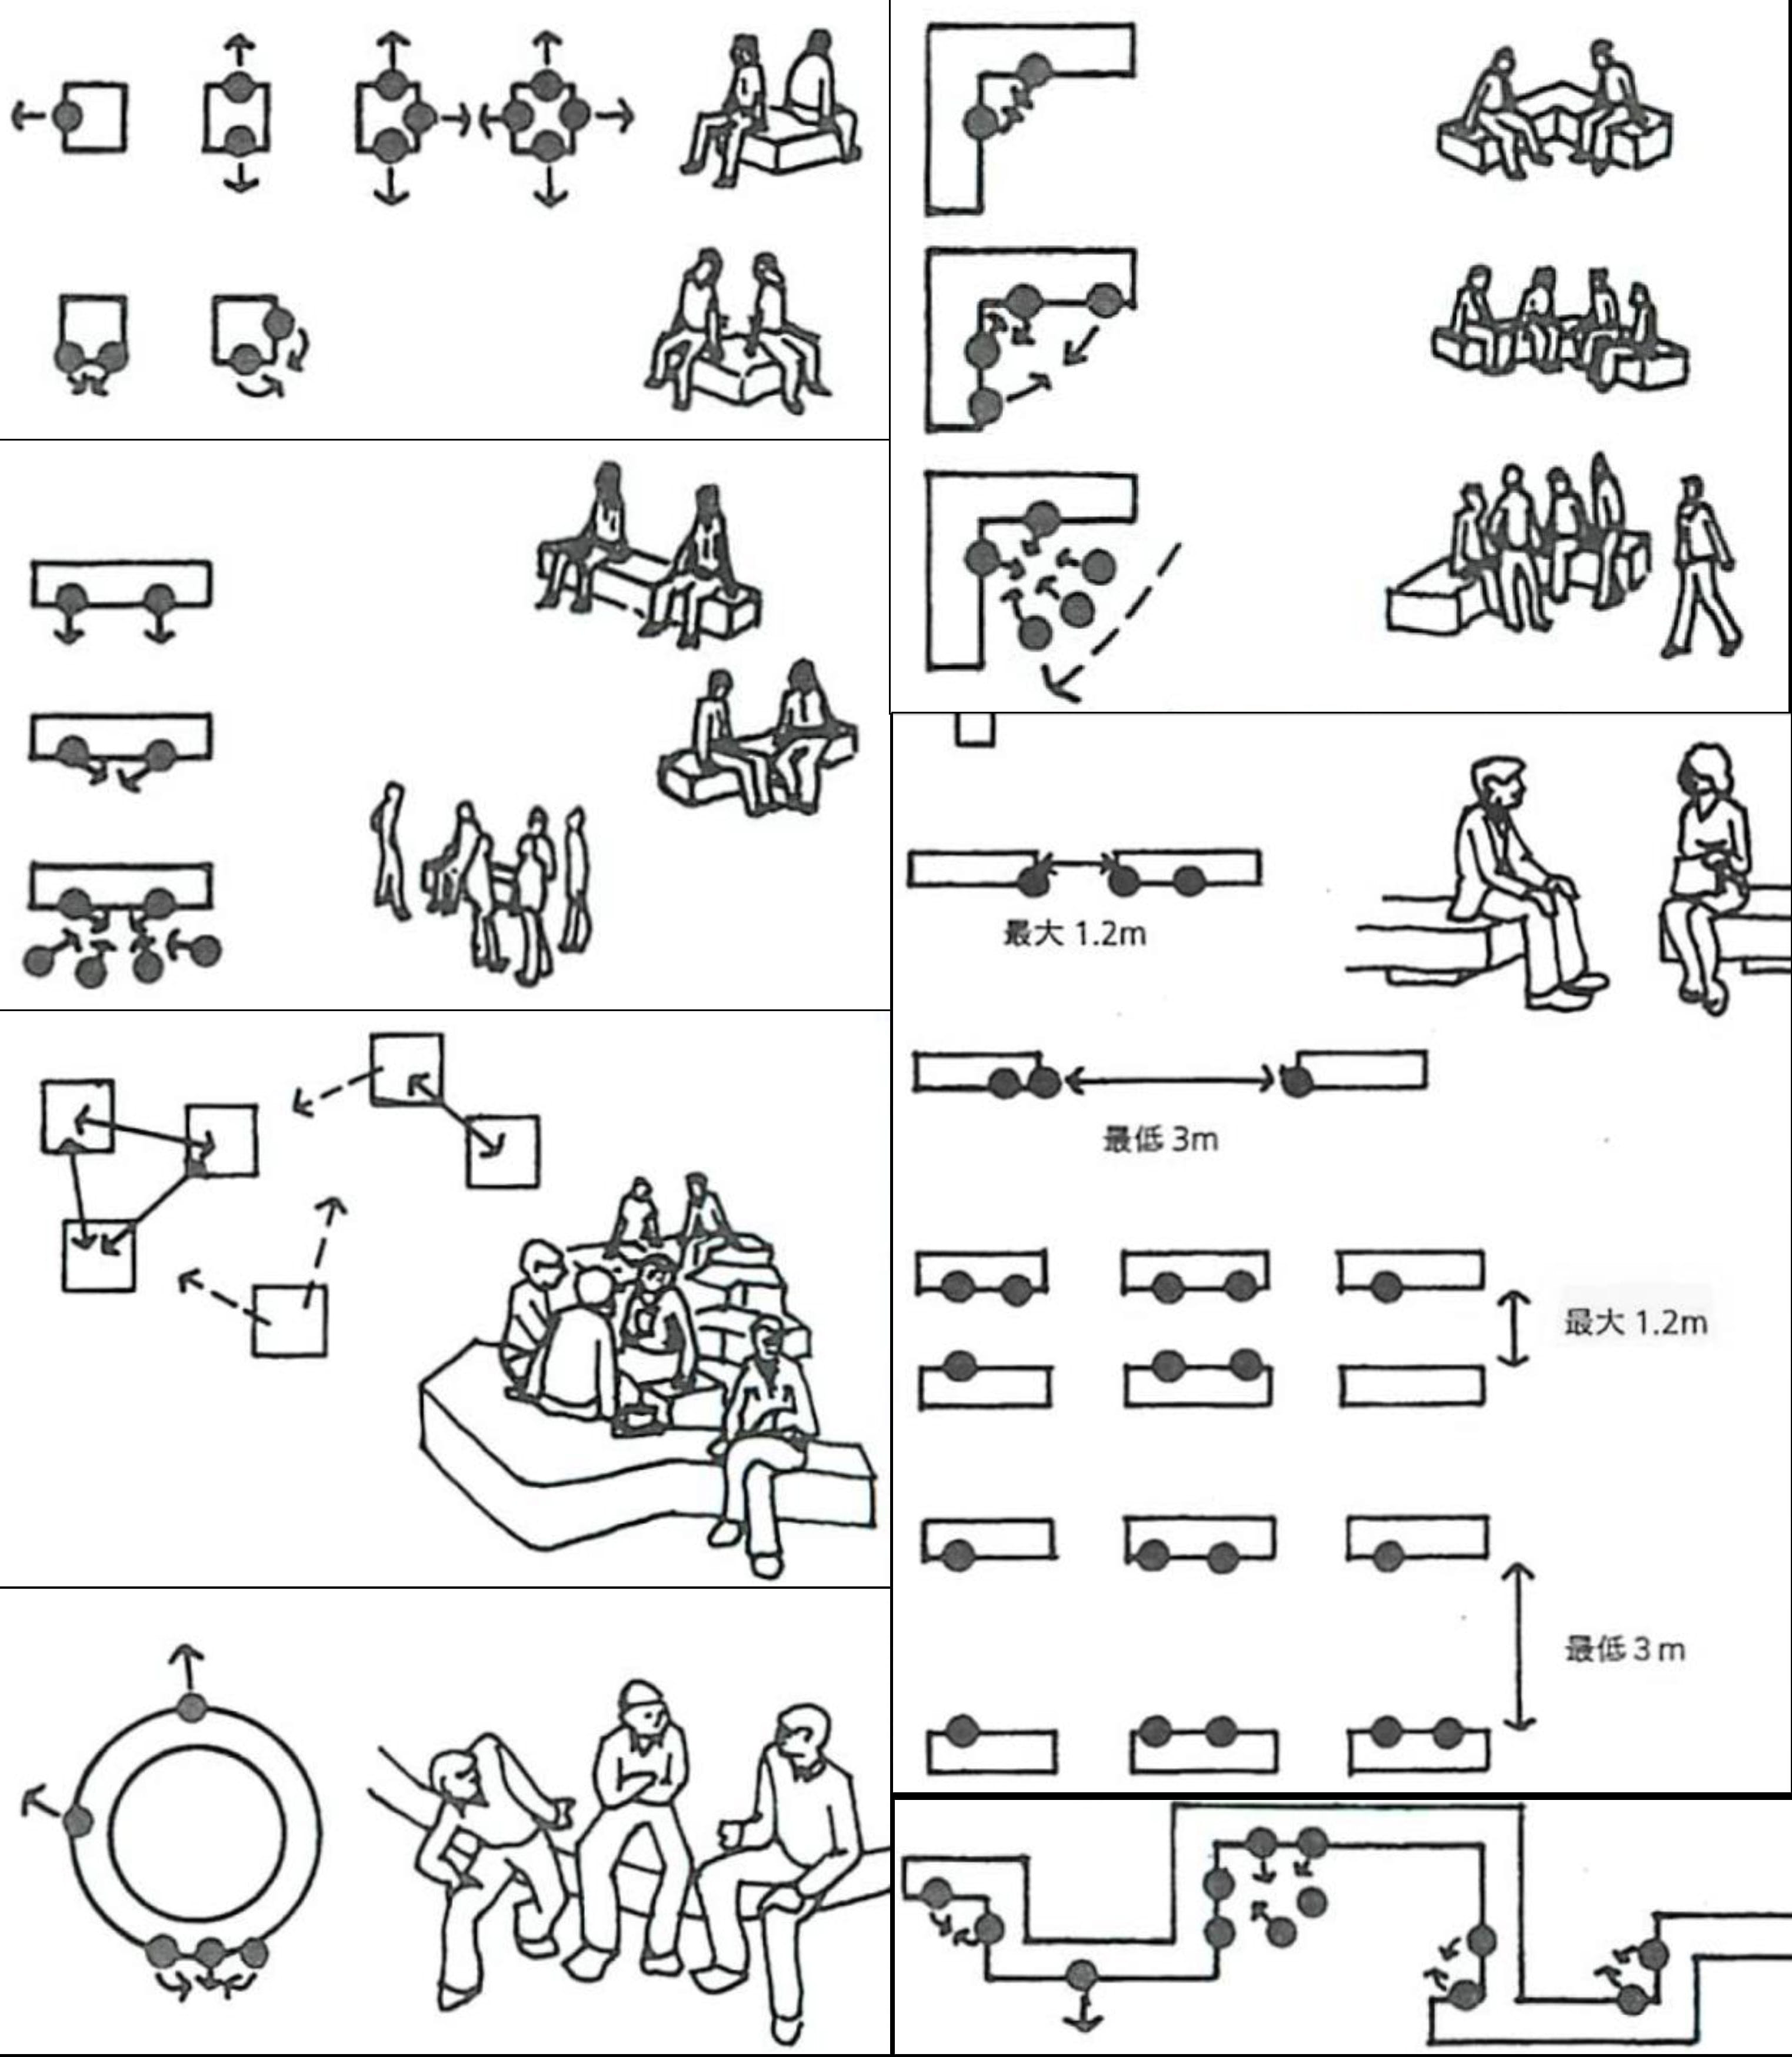
On-site observation studies (illustrated below) are an established method for understanding human behaviour in buildings and public spaces. The information that an observer can obtain by being “on site" is diverse, detailed and includes information that is unique to that location. However, it also has the disadvantage of requiring considerable effort, so is difficult to undertake frequently.
In contrast, data collection by analysing video images has the advantage that, once the system is installed, data can be obtained continuously. In this experimental survey, we attempted to see if it is possible to use these new technologies to complement established methods.
2.To understand the difference in usage according to layout pattern and position of the stool (chair)
The study addresses the question of how seating areas are used in museums. We prepared a number of scenarios in which the location of stools was changed in order to see if this created any differences in patterns of stationary activity. First, whether people think "let's sit down here"? Then, in which direction do people face when sat down? The assumption was that some positions would be popular and some would be unpopular. And that there would be some positions that are more suitable for particular activities, such as taking photos. The aim of this study is to develop our knowledge on these phenomena.
Technology overview
Technology overview
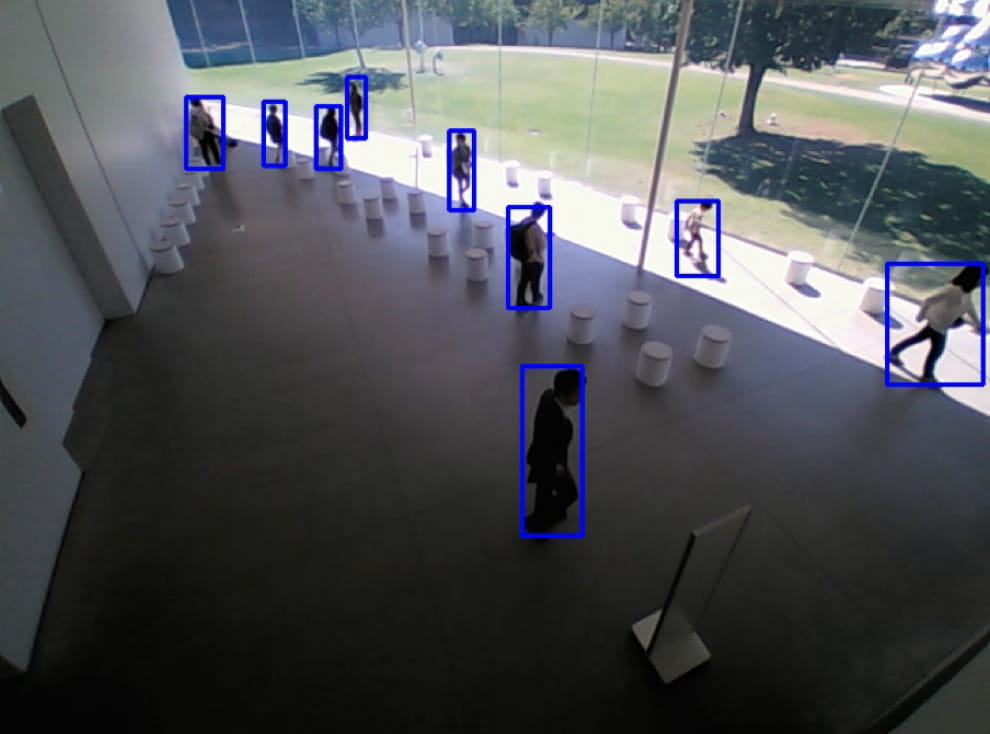
In this experimental survey, data was acquired using a camera (normal webcam) fixed to the ceiling near the entrance to the Citizen’s Gallery and connected to a PC. A software program was used to obtain location data from the captured video. In this experiment we used an object detection algorithm called YOLO, developed by Joseph Redmon and others at the University of Washington in the United States. This is a technology that uses a deep learning technique that detects an image area that seems to be an object and identifies what the object is. Many researchers publish such programs and share information that contributes to the development of the technology.In this way, we aimed to obtain data in the simplest, most effective way for the purposes of the research.
Reference : Joseph Redmon, Santosh Divvala, Ross Girshick, and Ali Farhadi, You Only Look Once:Unified, Real-Time Object Detection, 2016
Video image capture in the exhibition room
Video image capture in the exhibition room
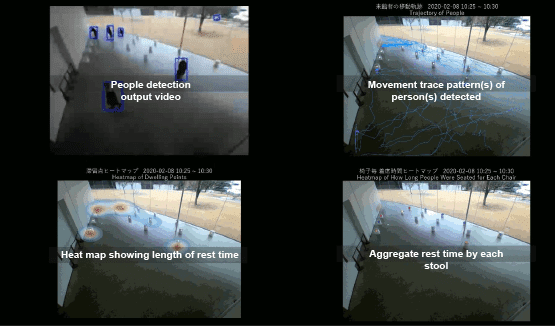
5-minute video clips were processed by the on-site PC then displayed immediately in the design gallery, as shown below.
Overview of the experimental survey
Overview of the experimental survey
We conducted the experimental survey in the free public zone on the west side of the museum, over a period of 99 days.
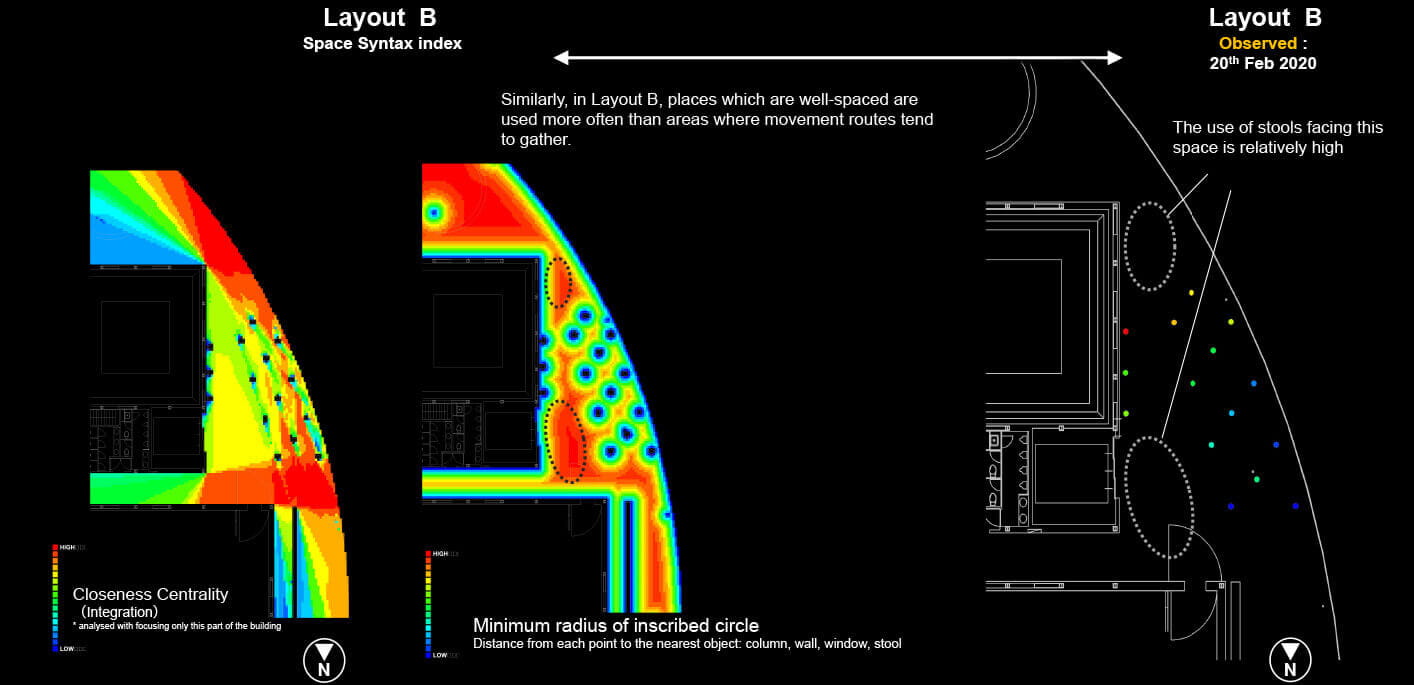
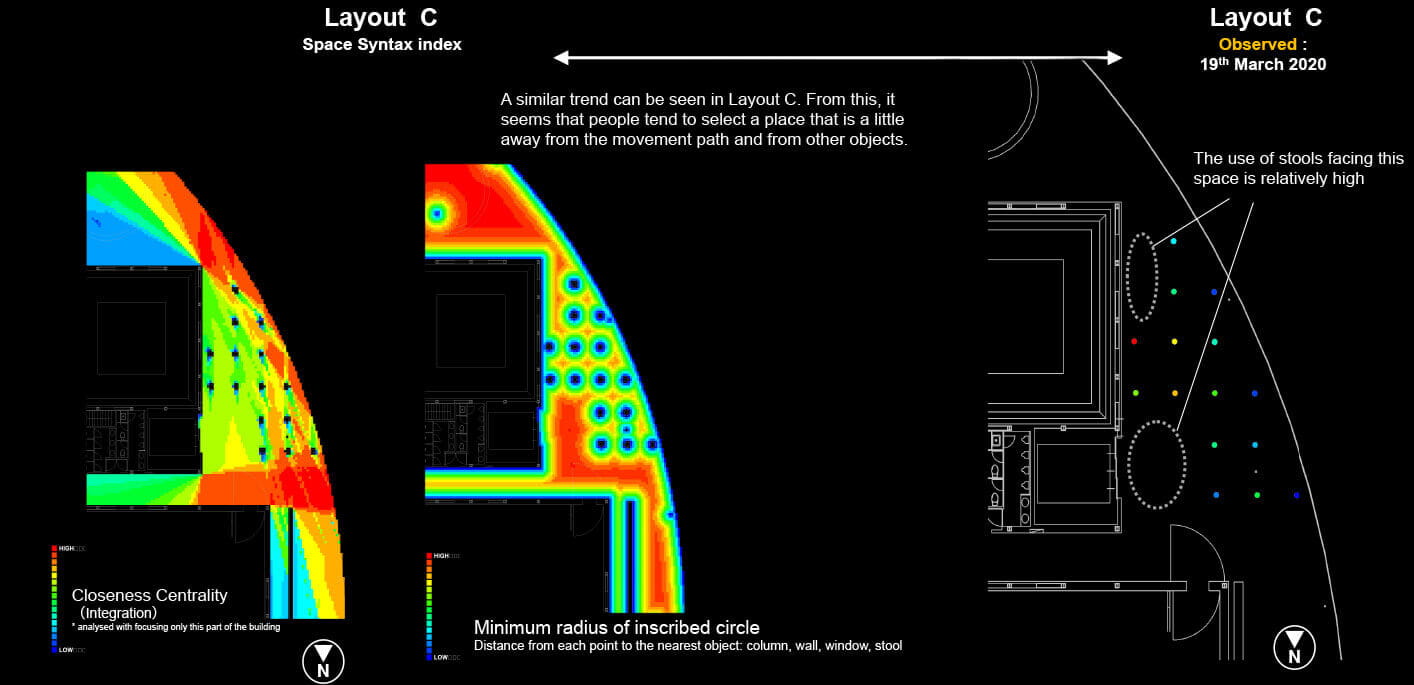
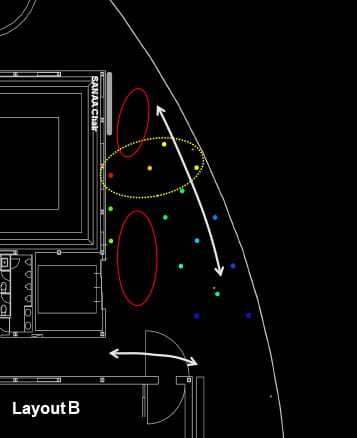
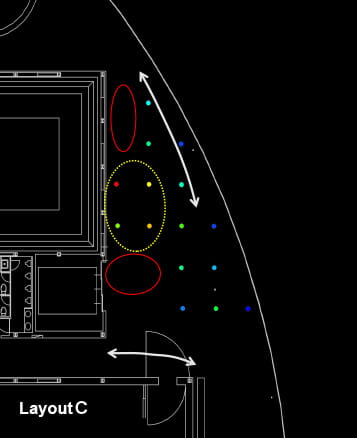
Data were collected for the three furniture layouts shown below. In the layout B and C, we made the distances between stools greater, in line with coronavirus prevention regulations.
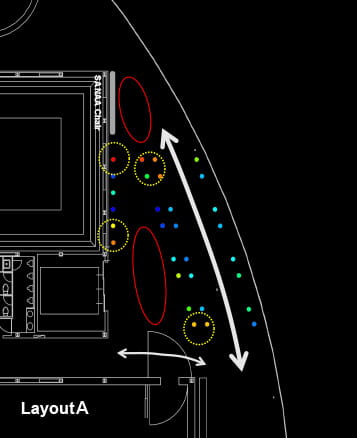
LayoutA: 12th October - 19th December (46 days)
LayoutB: 4th February – 28th February (25 days)
LayoutC: 17th March – 13th April (28days)
Findings
Findings
Daily variations in numbers of people detected
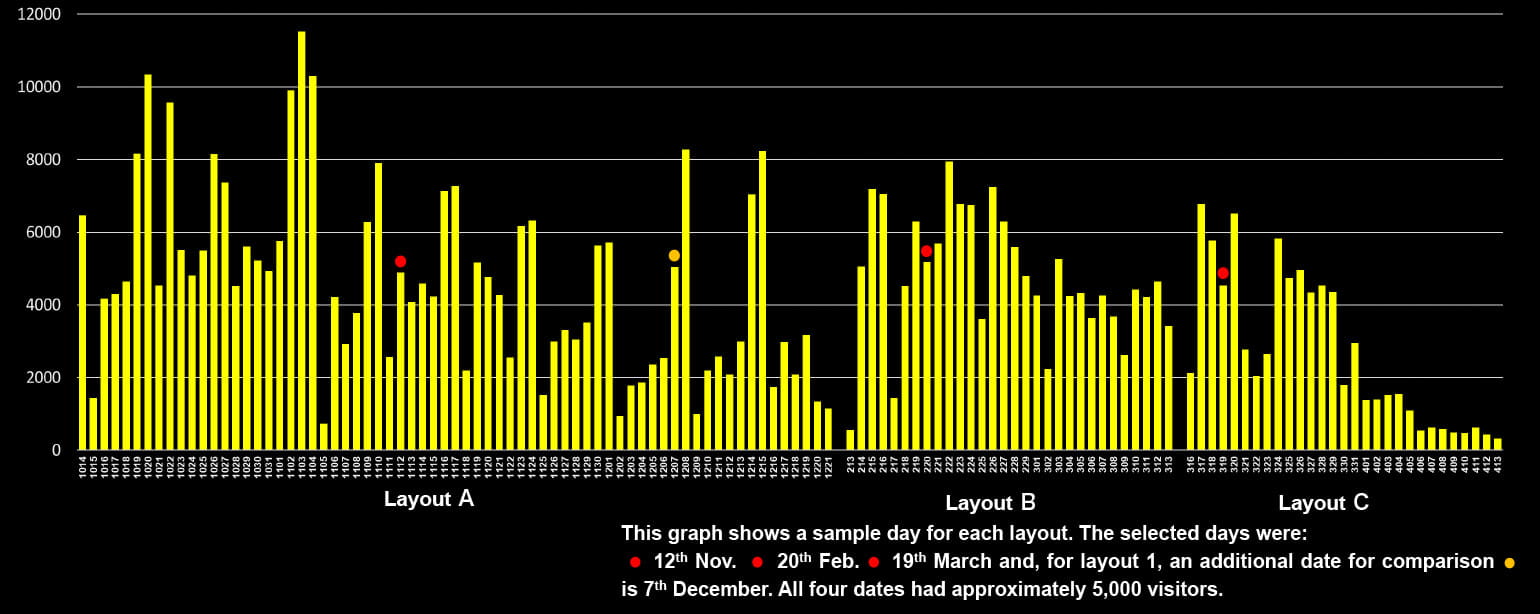
First, let’s look at a simple representation of the data, showing the number of people detected from the video capture. In the graph below, the horizontal axis shows the date: 14th October to 13th April, and the vertical axis shows the number of people. Although there may be some inaccuracy caused by first, the method of aggregating the 5-minute counts, which may have caused some double counting, and second by camera positioning, which may have led to some people outside the space being counted through the glass, the data is useful enough to generate an understanding of the rough number of visitors in a relatively simple way. For example, the weekends clearly have the higher visitor numbers, and the big drops are caused by the closure of the galleries.
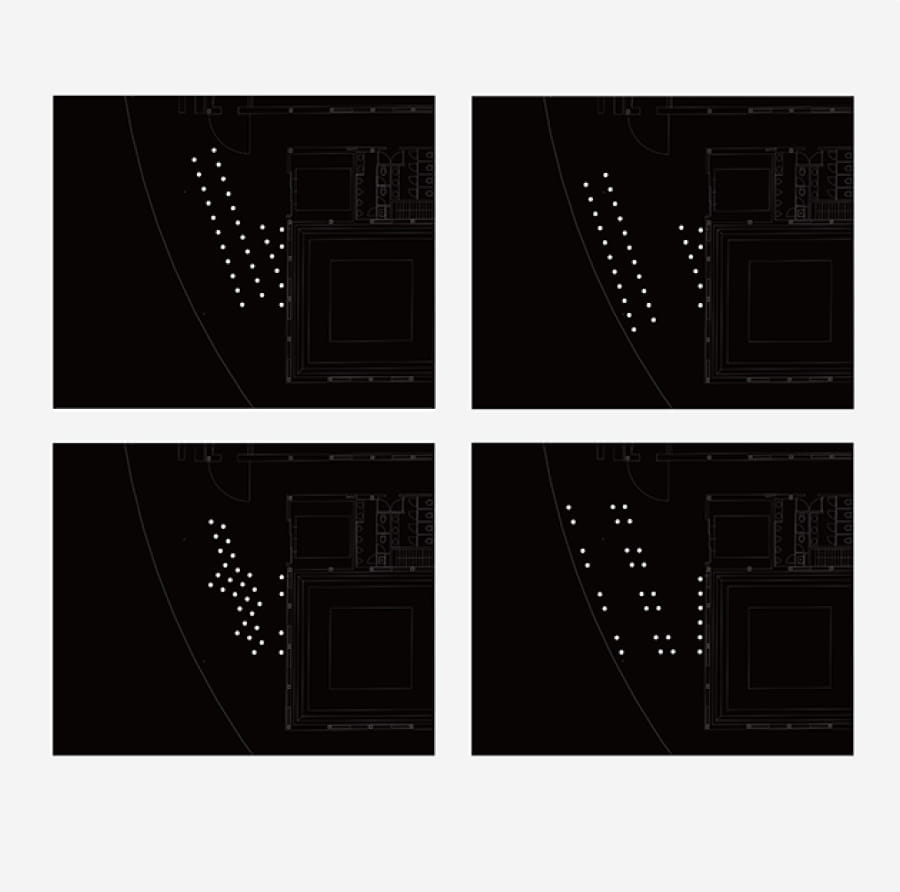
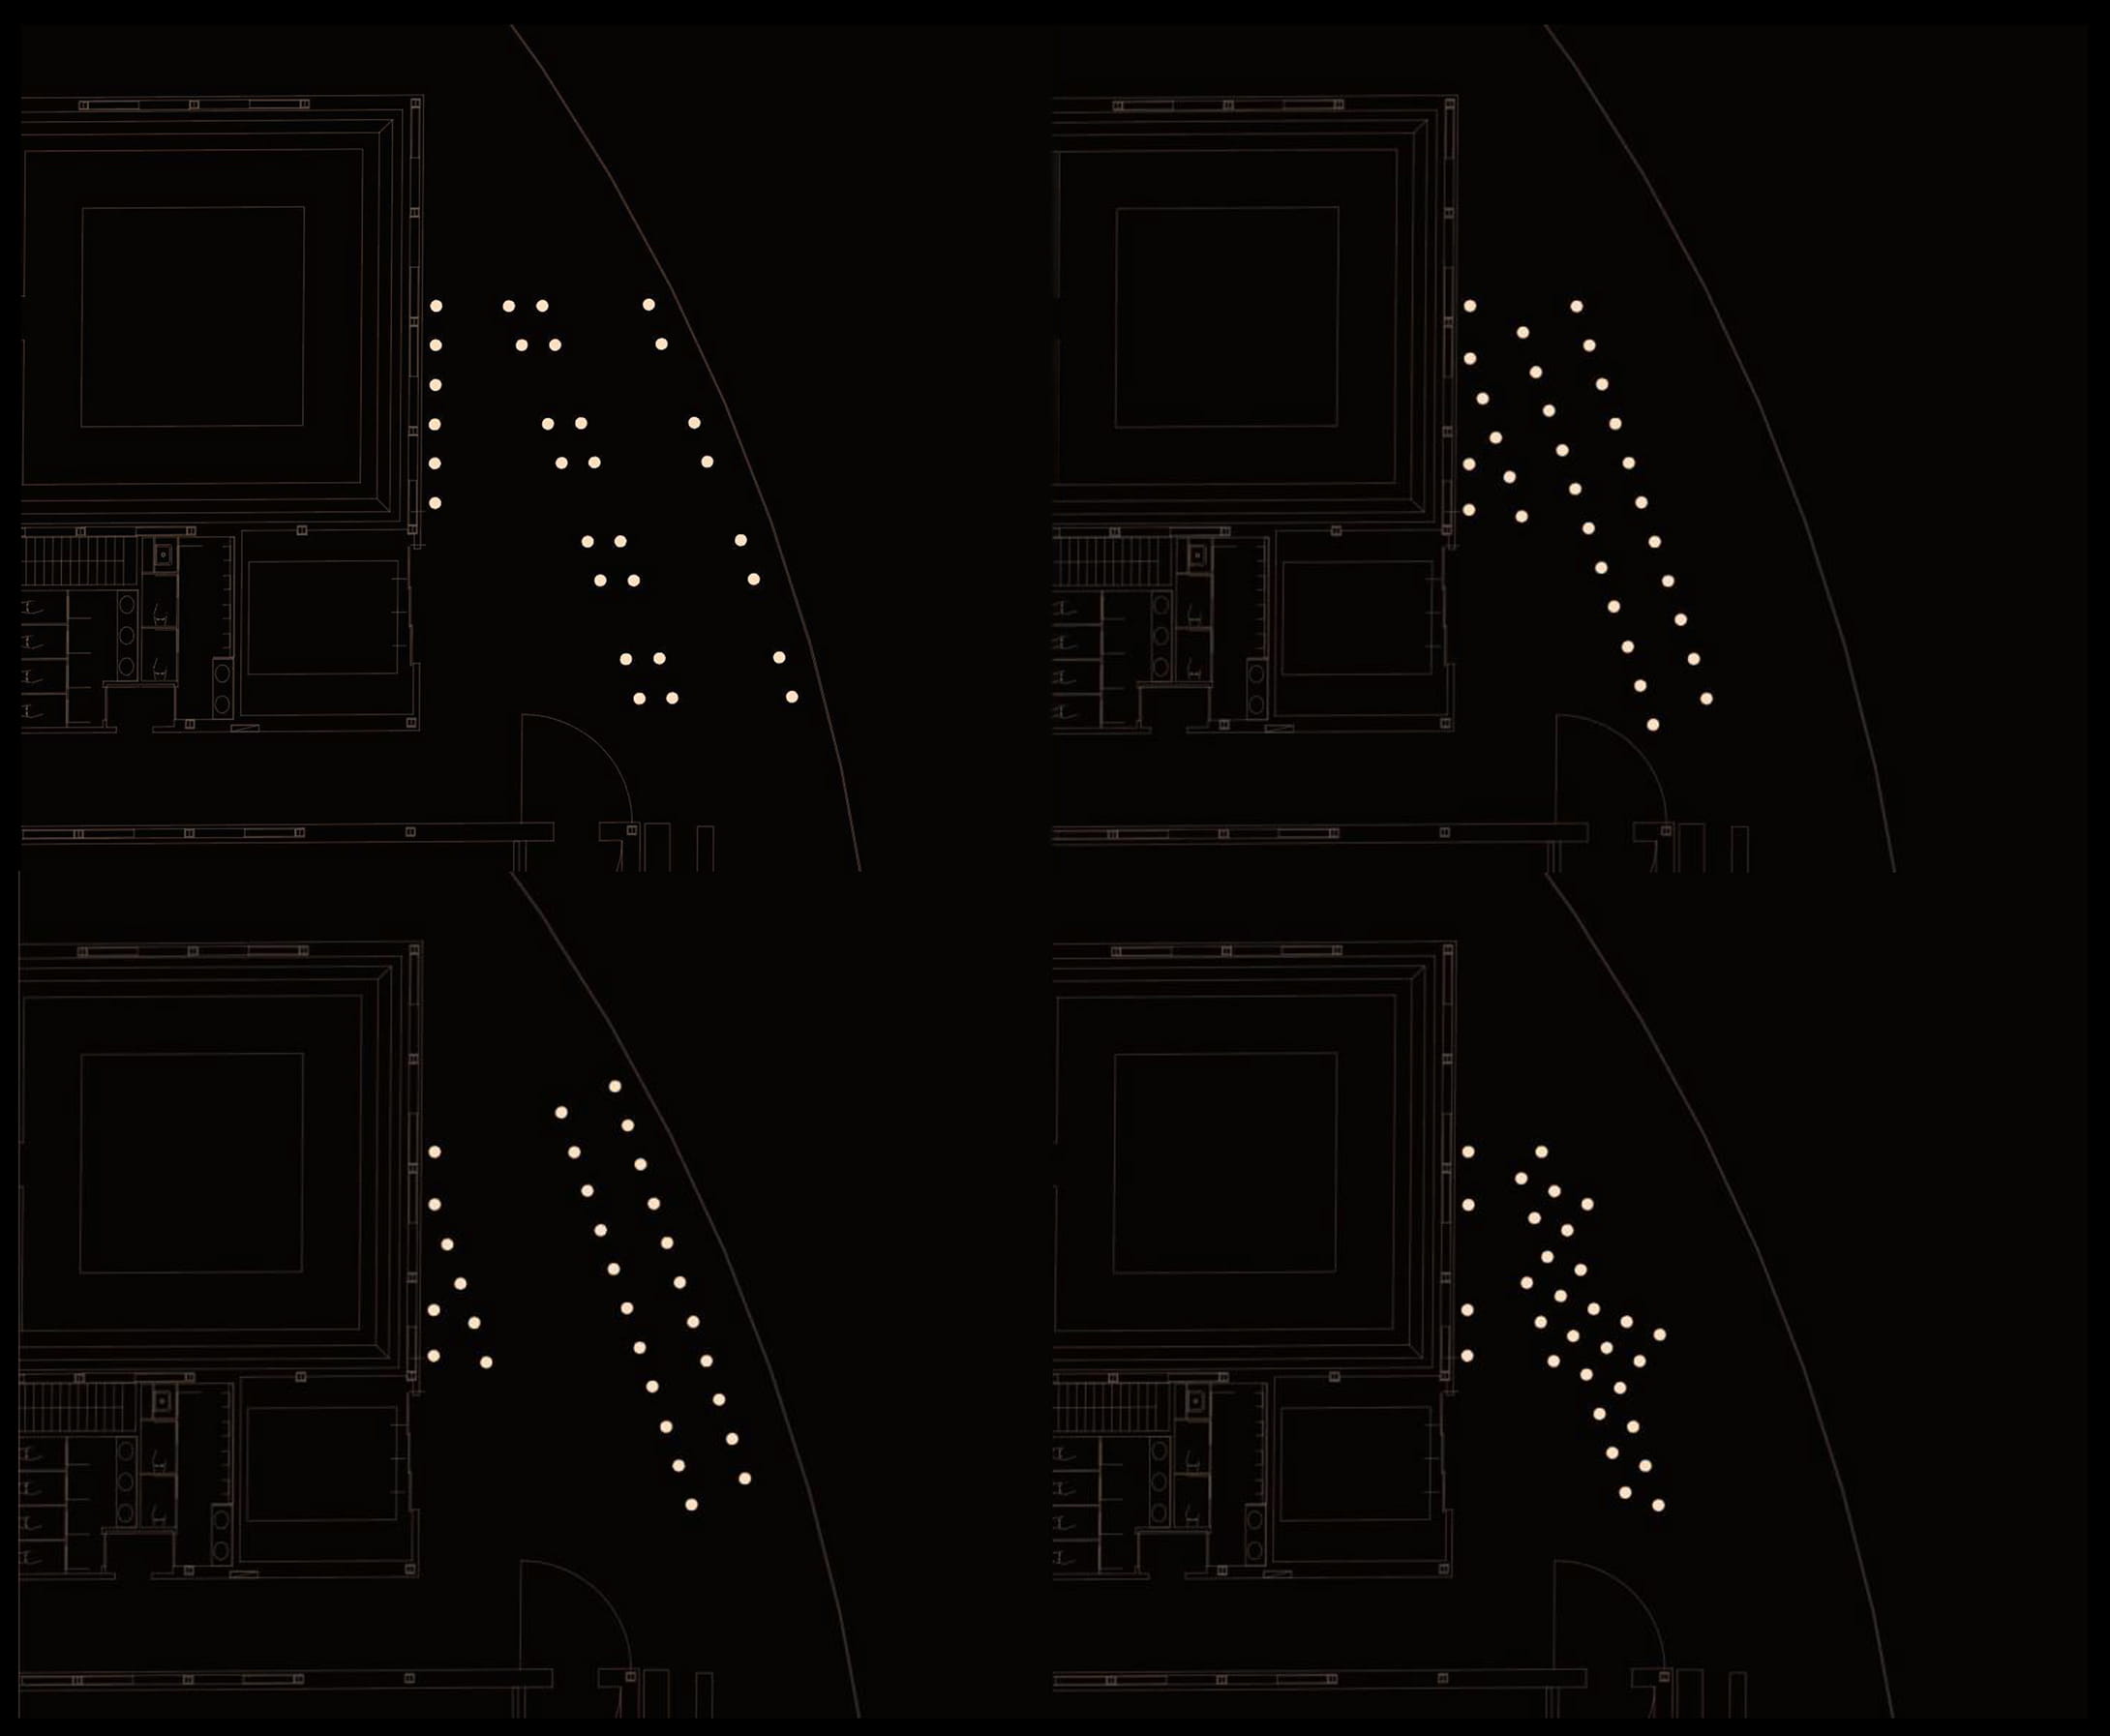
Trace patterns for each layout
Layout A
Layout B
Layout C
Let’s look at the movement trace data for the sample day for each layout.The videos below show 5-minute movie clips for each day.
Although there are some seemingly "unnatural" traces, it is possible to gain a general sense of what was happening in terms of movement paths, turns, stopping activities, and so on.
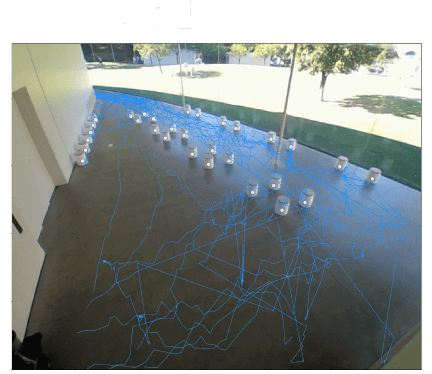
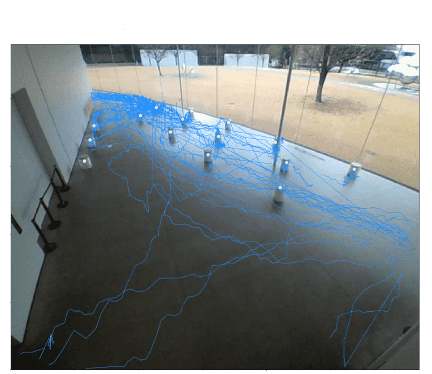
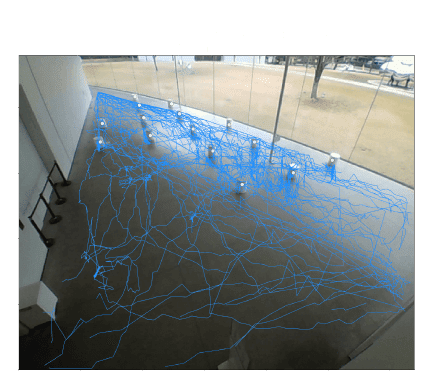
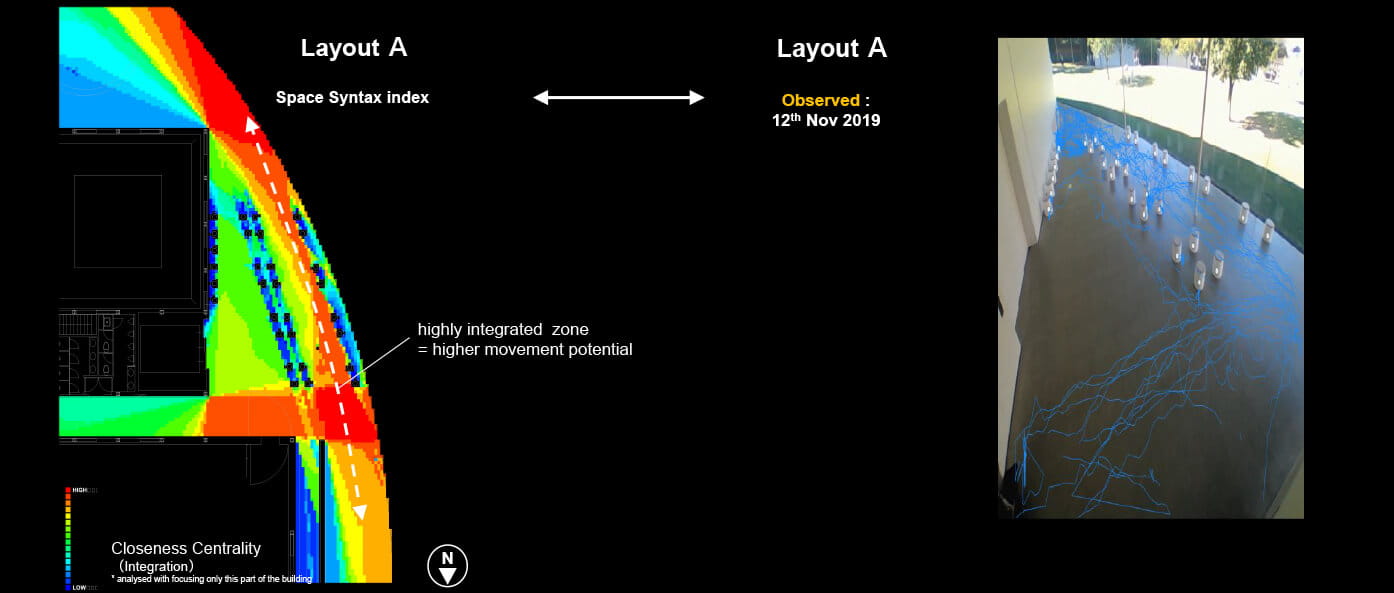
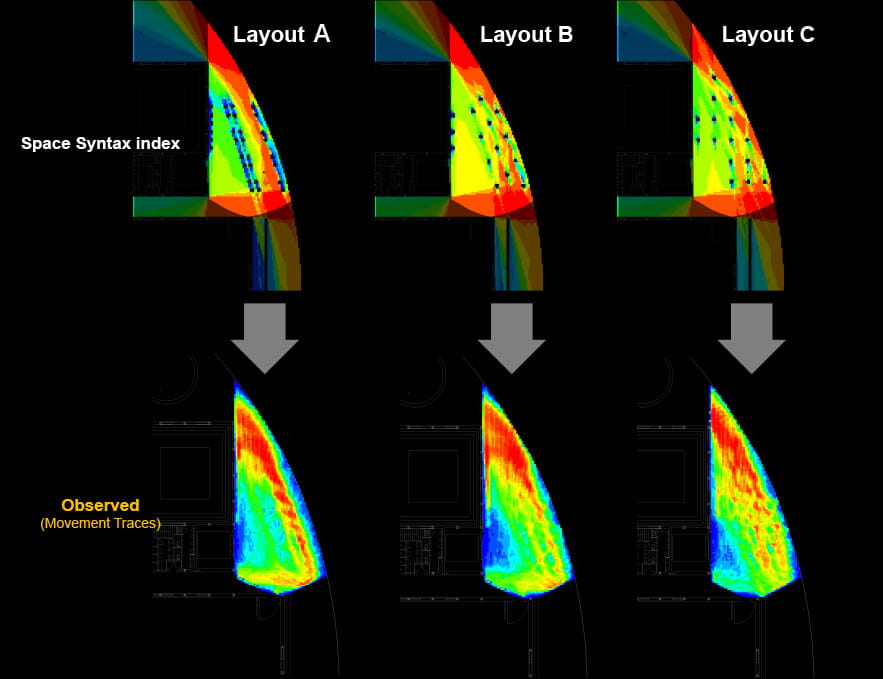
In Layout A, many people walk along a line near the window at the outer perimeter of the building.In Layout B, there are more variations in the individual movements traces, including curved routes around the far side of the picture.In Layout C, there are more complex patterns of movements with more changes of direction.
From these results it seems possible to detect clear differences in the trace patterns for each layout.Let's see the relationship between these patterns and Space Syntax spatial indeces.
Consideration
Consideration
Trace patterns for each layout
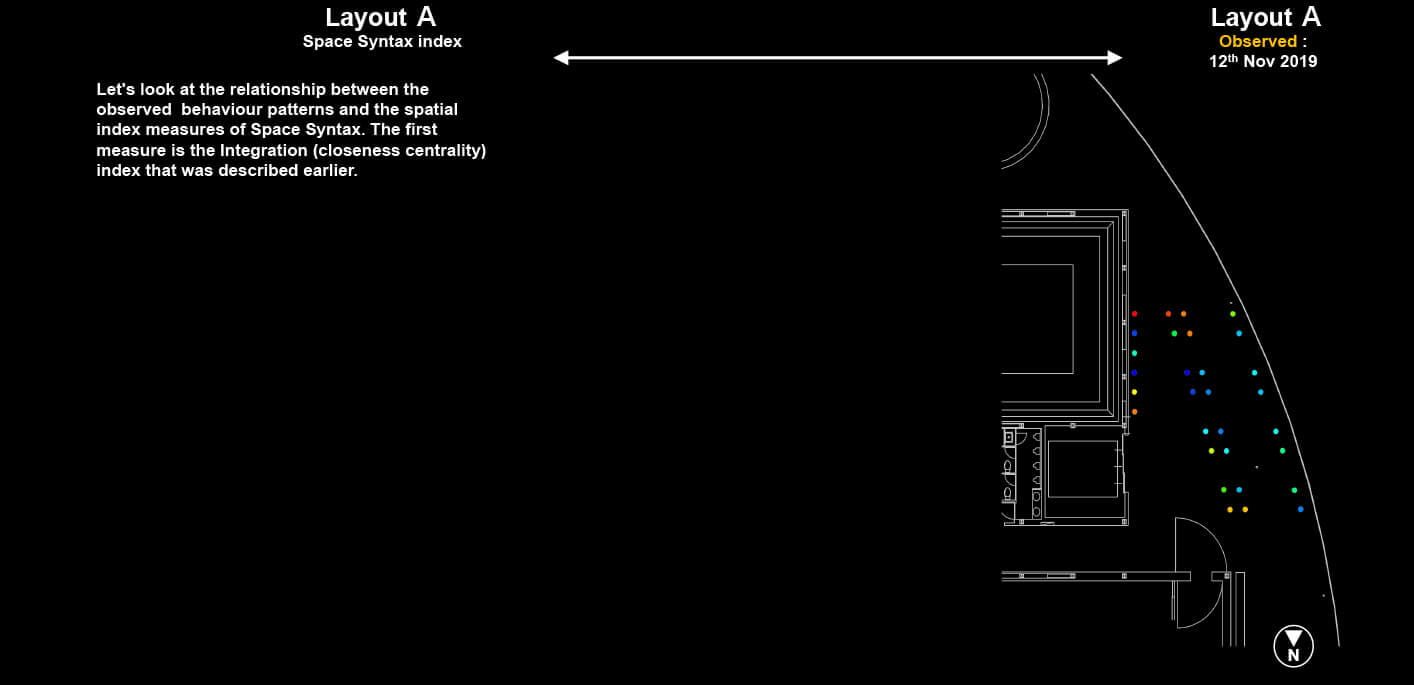
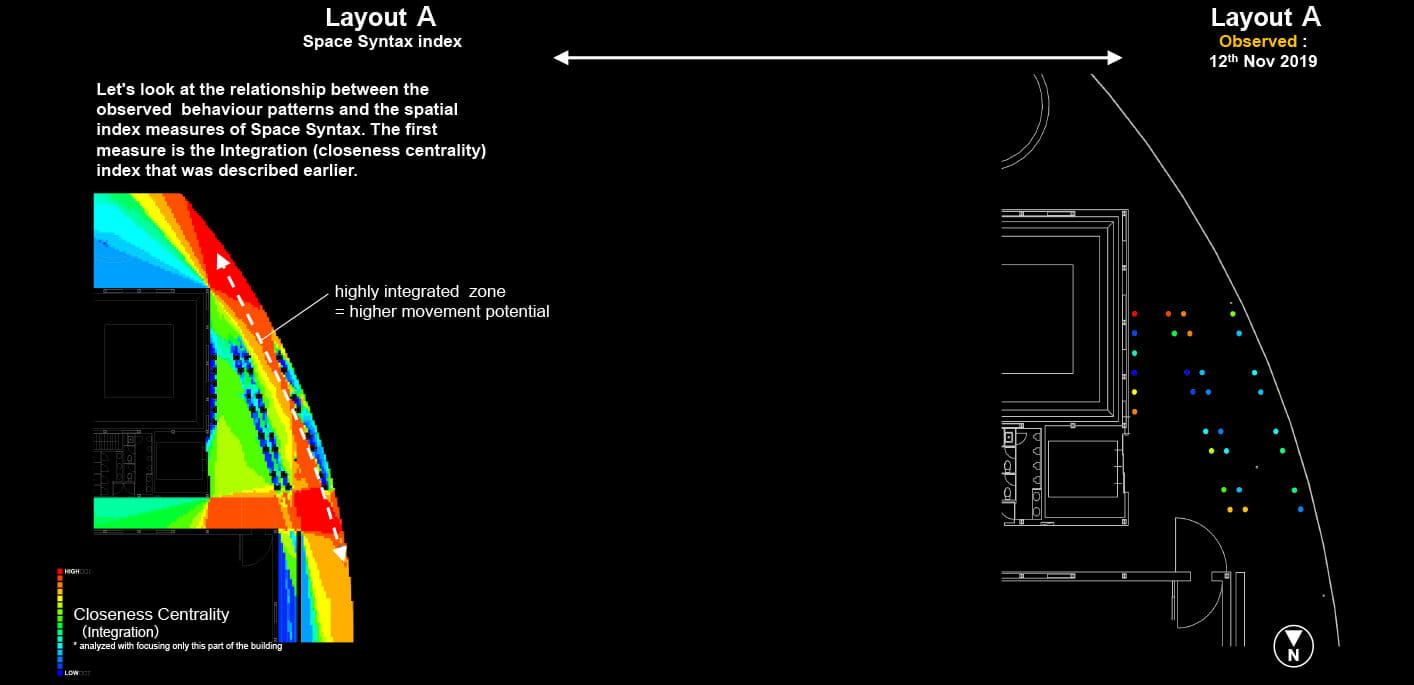
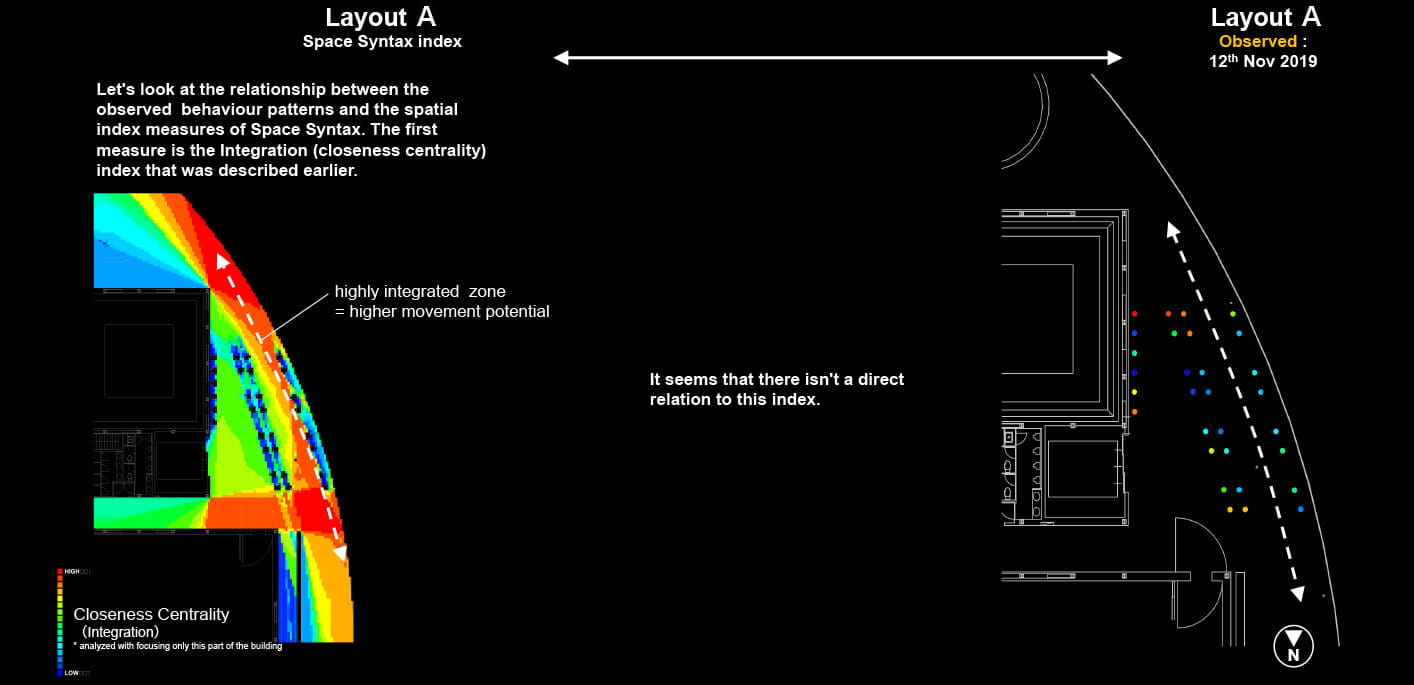
Previous research has shown that there is a close relation between people’s movement patterns and the Space Syntax index of "integration" (closeness centrality).
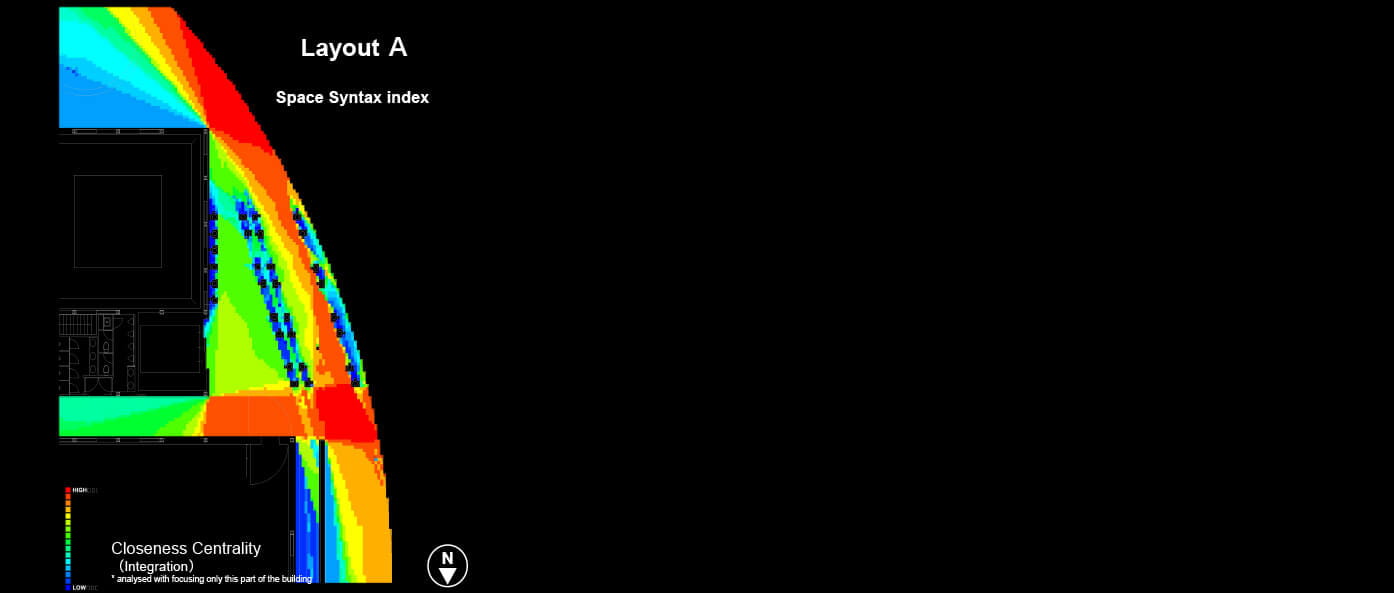
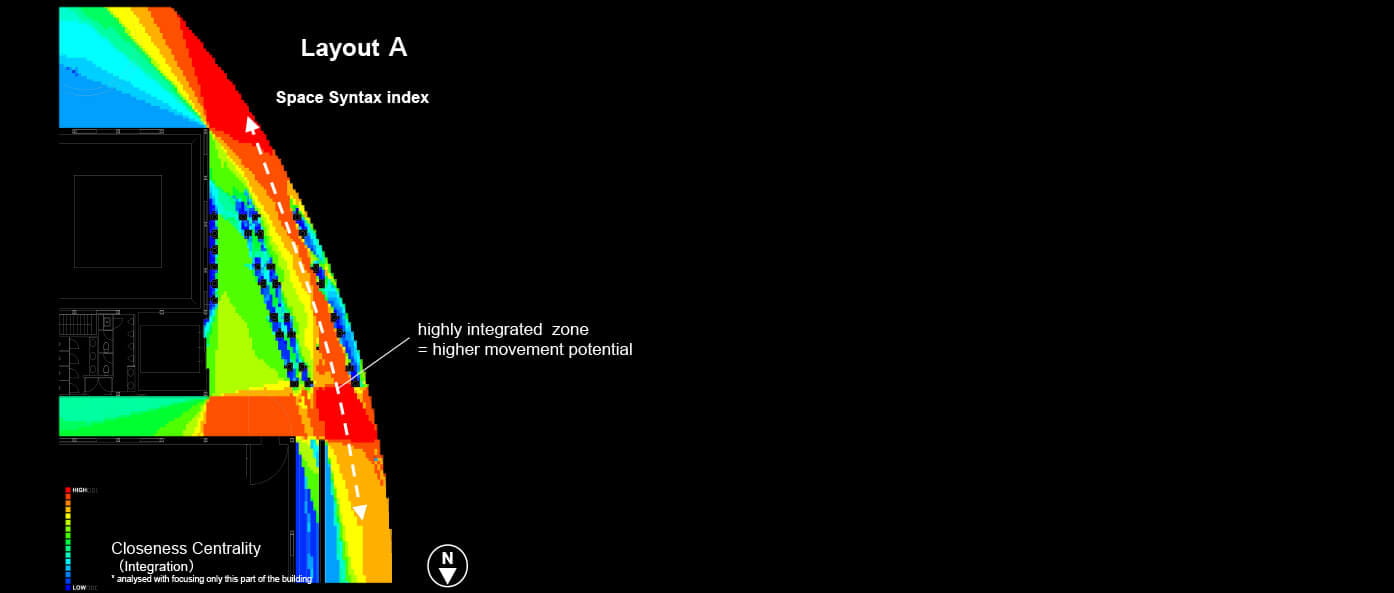

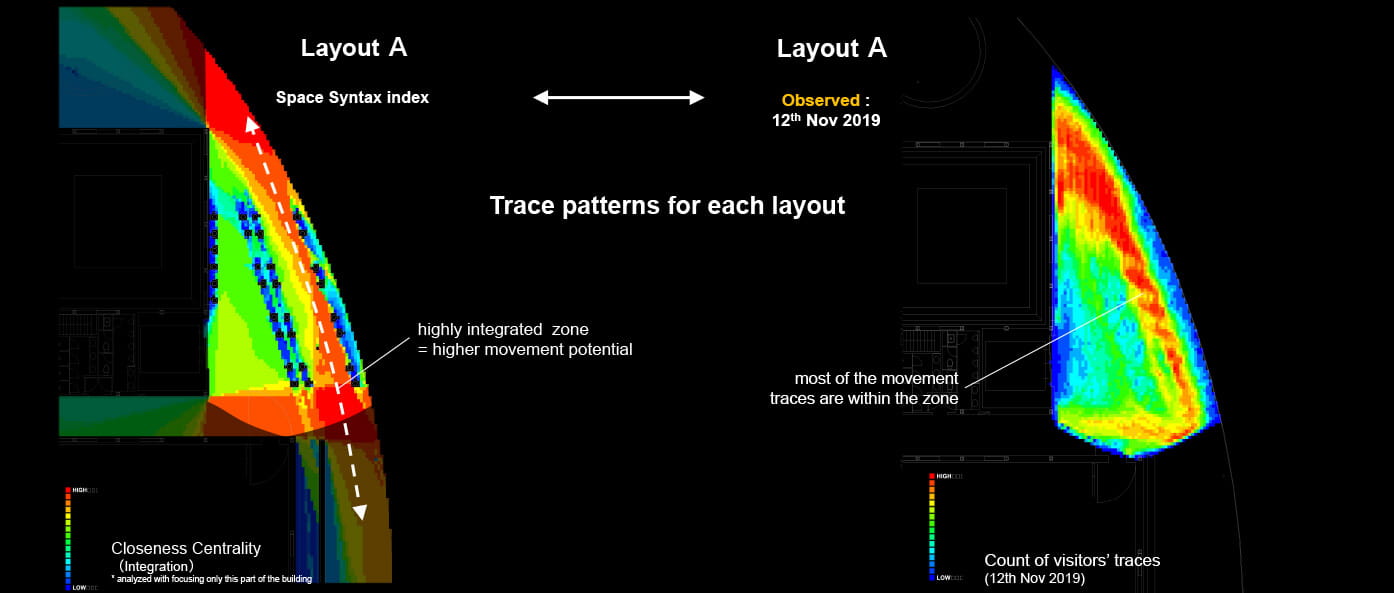

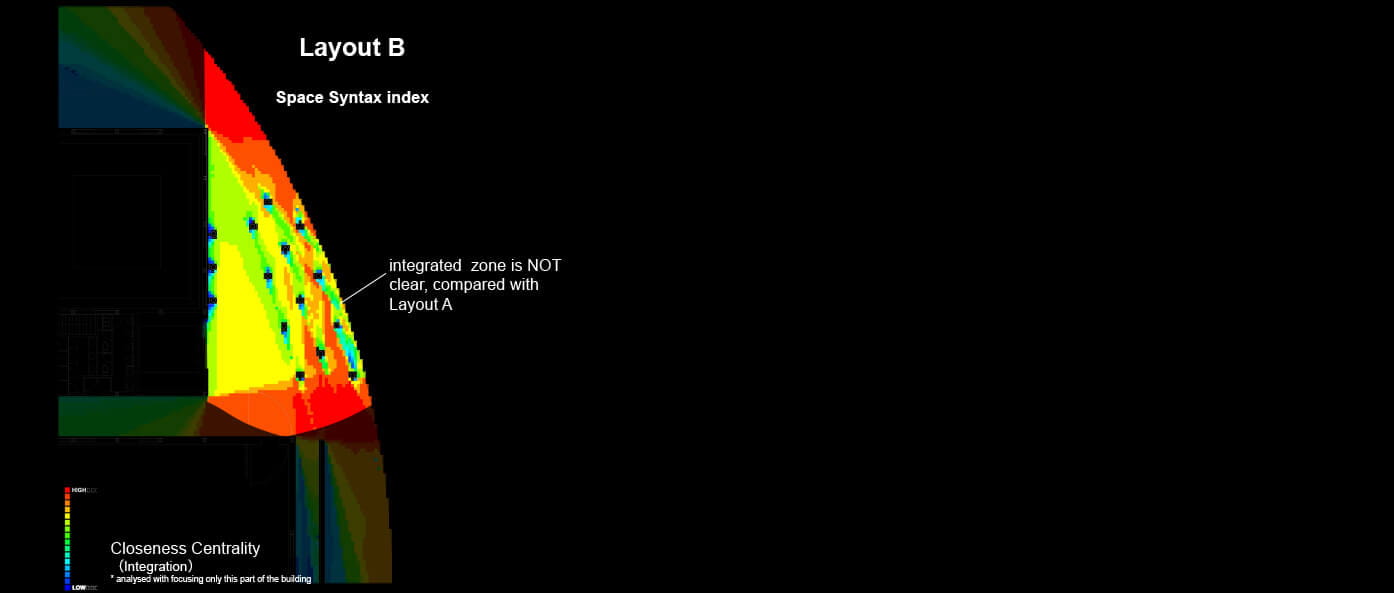
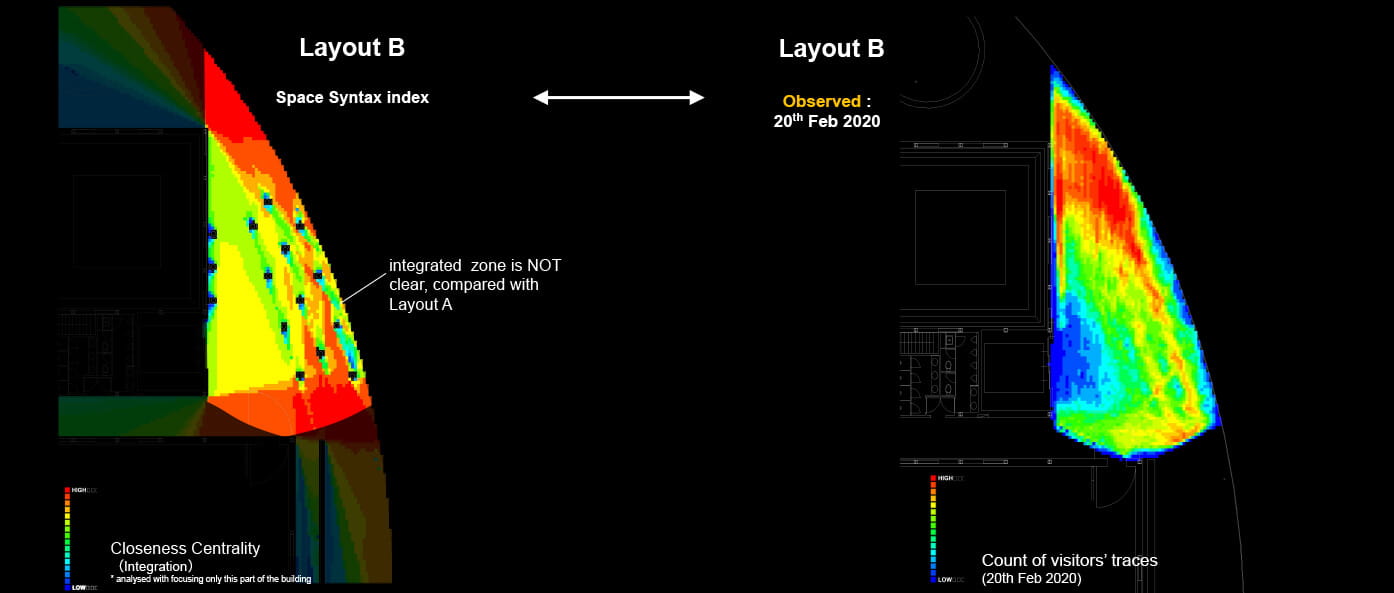
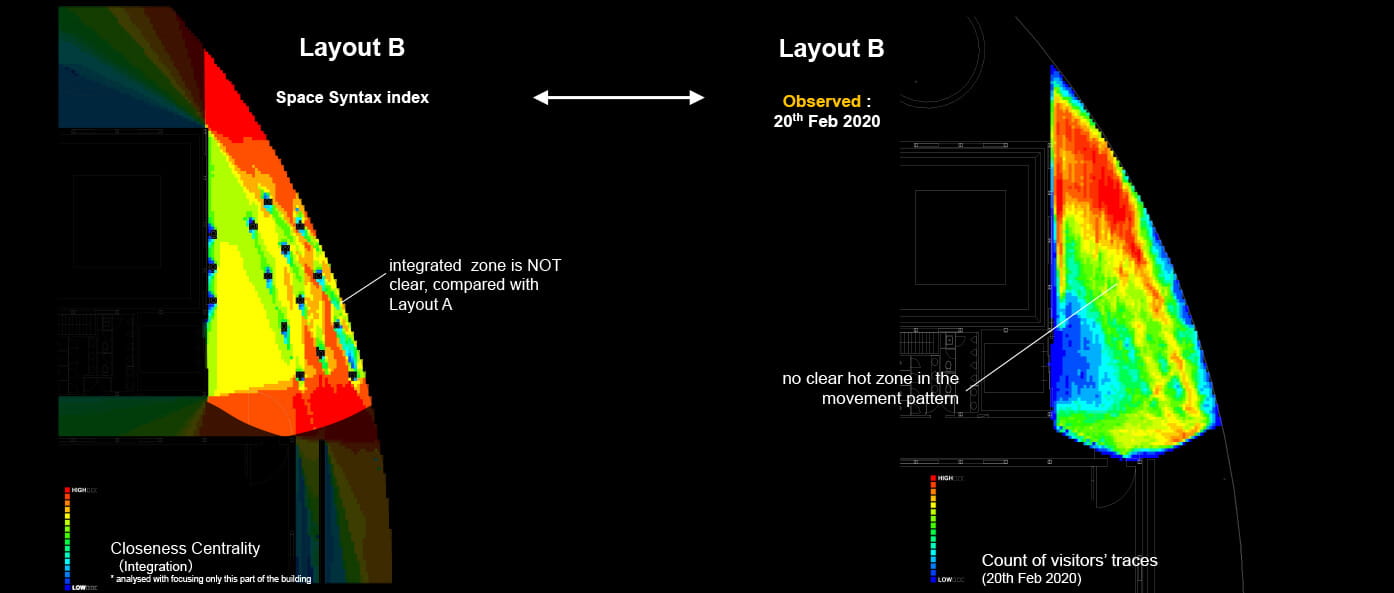
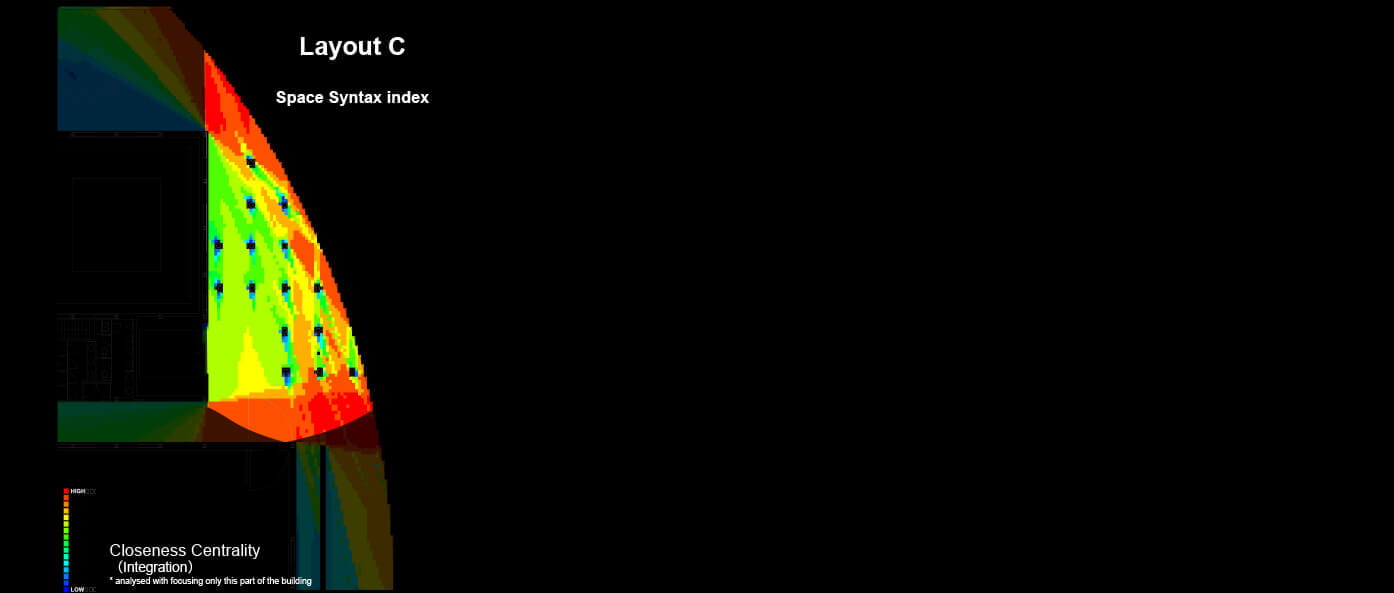
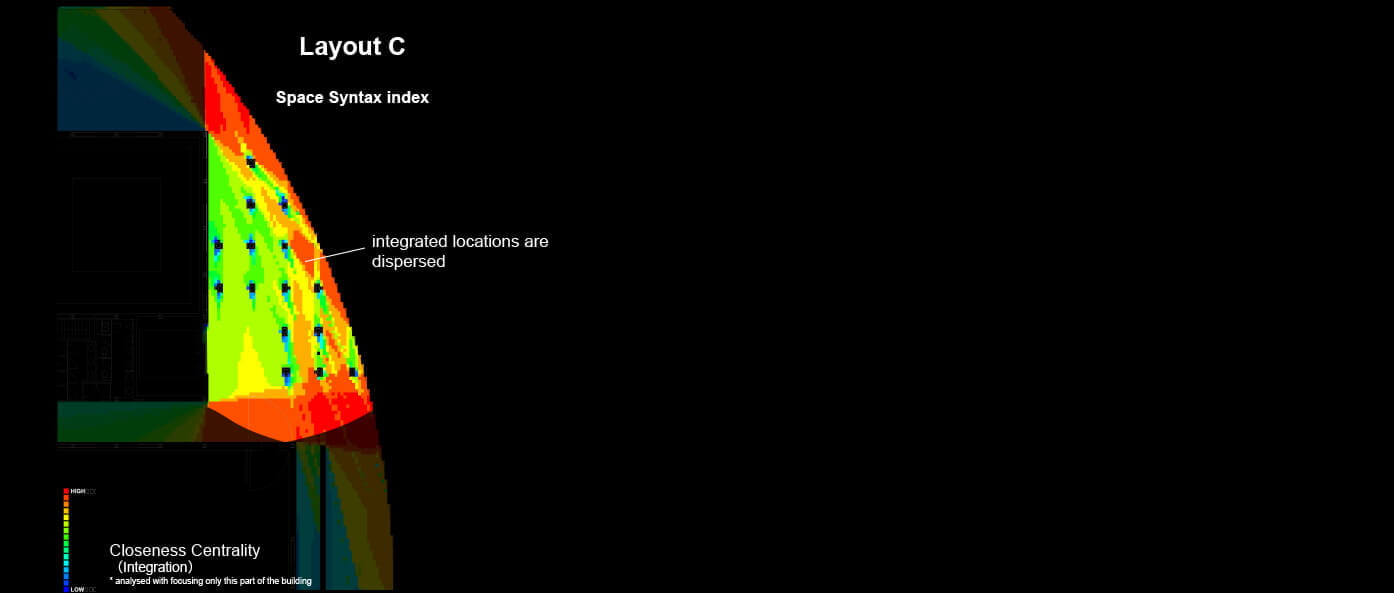

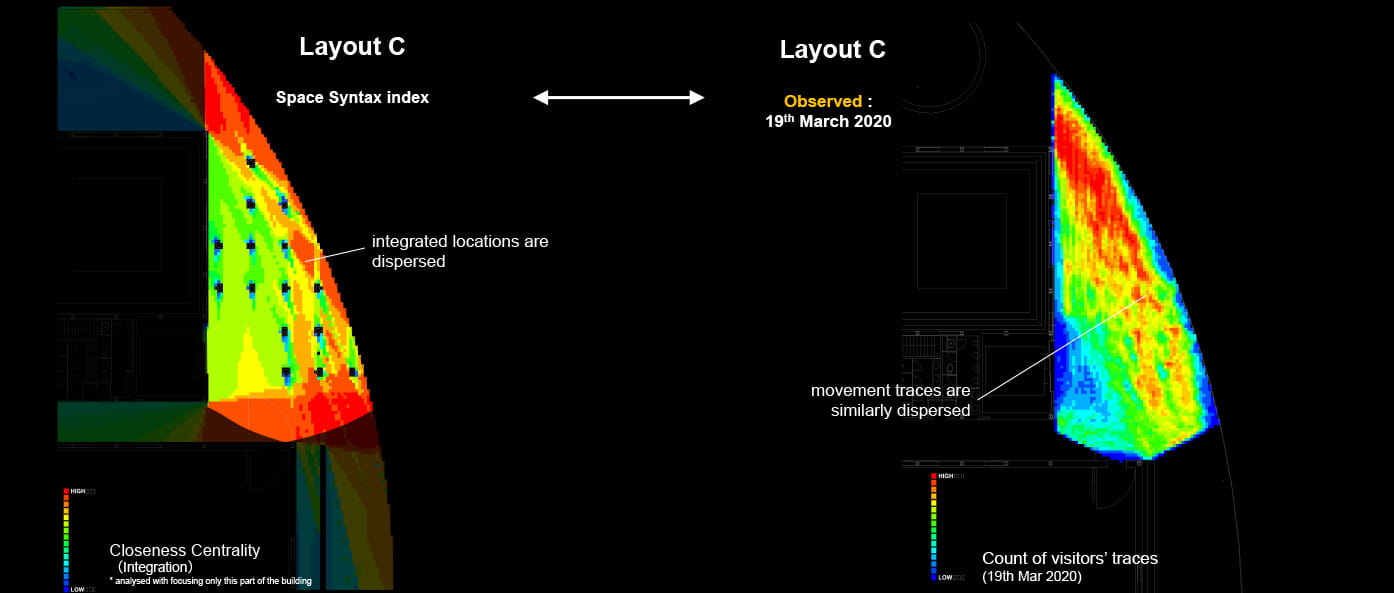
By looking at the distribution pattern of the Space Syntax index in each layout, it seems possible to discern a general influence on people's natural movement patterns.
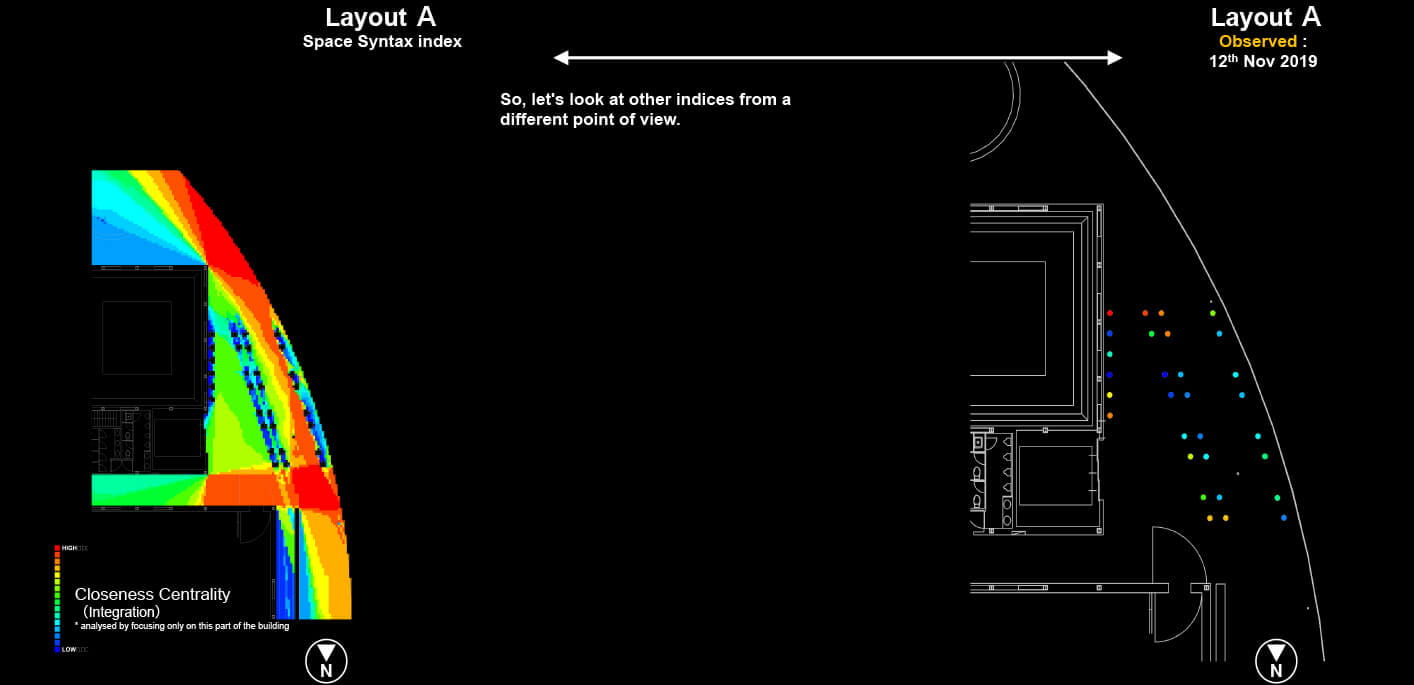
Next, let's examine the distribution of stool usage.
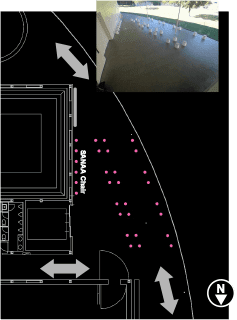
Distribution of stool usage for each layout
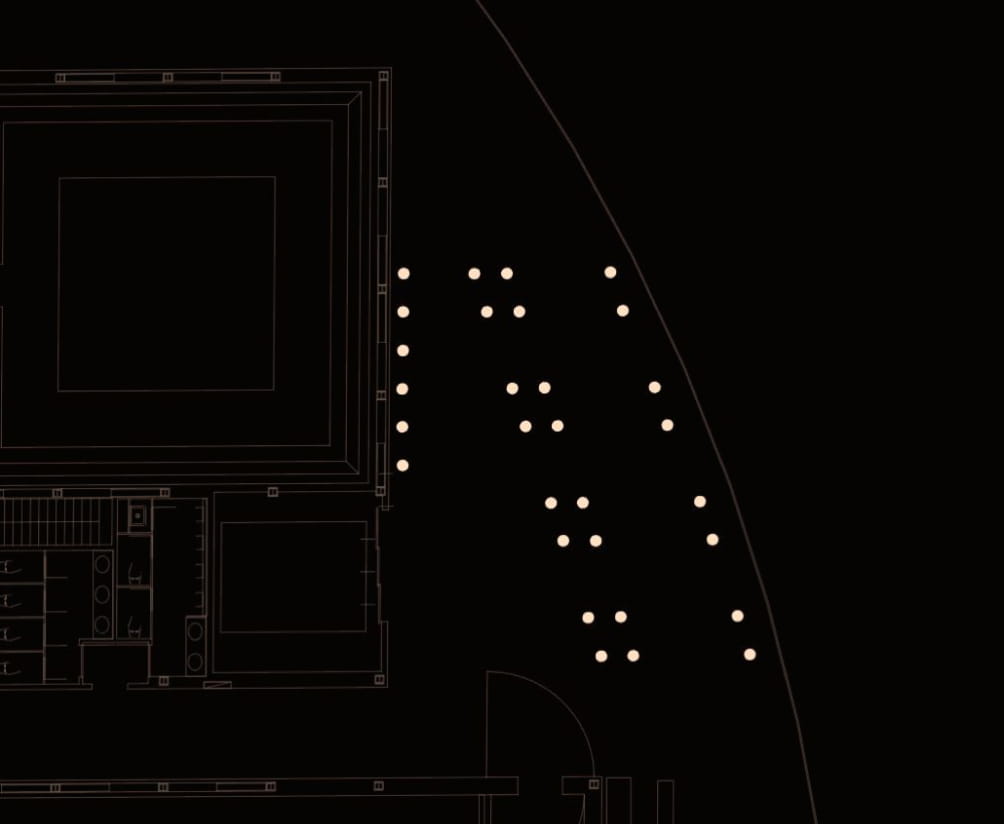
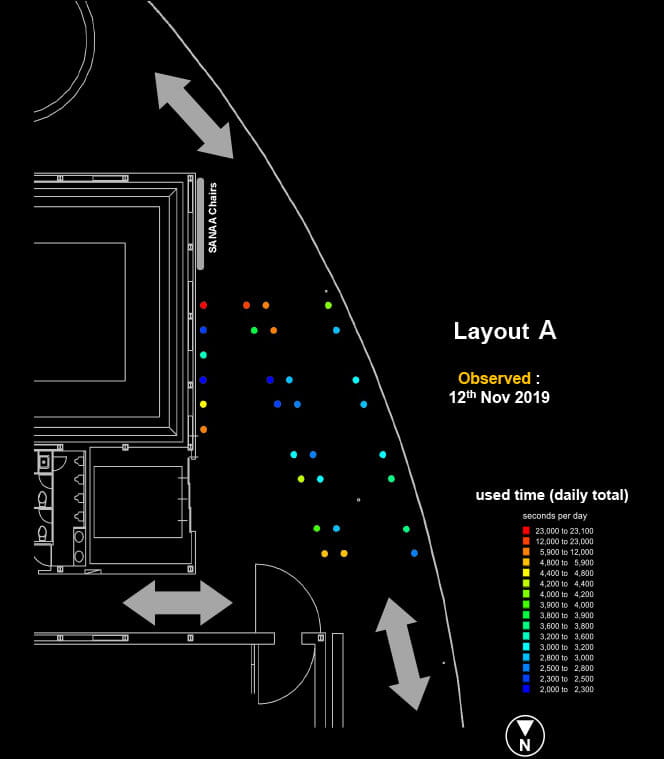
Finally, let‘s look at the differences in how stools were used for each position in each layout.
From video analysis of the representative day for each layout, the duration of time (seconds) while each stool was being used has been aggregated.
First, let’s see which stool was used most often in Layout A.
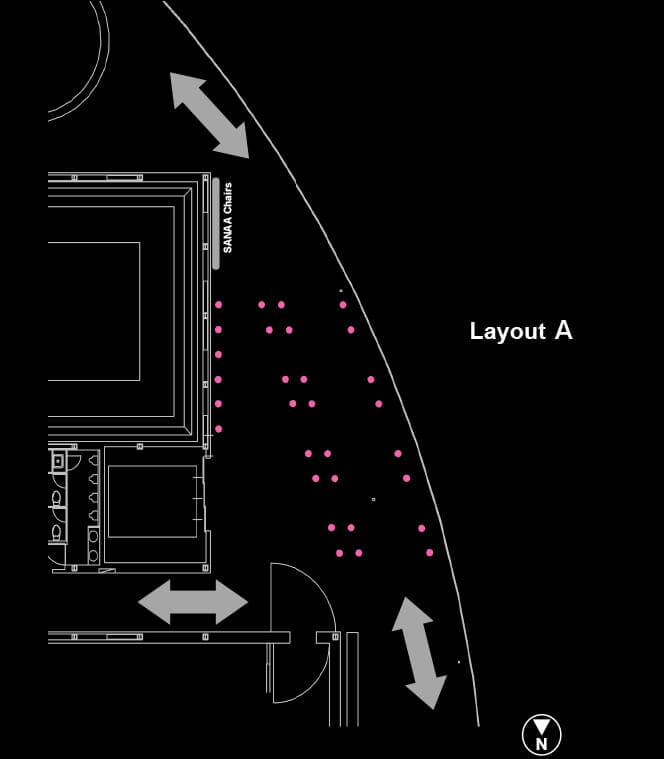
The stool near the SANAA chairs at the southern end of the space was used for the greatest length of time.
Some stools in the northern part of the space were also well used.
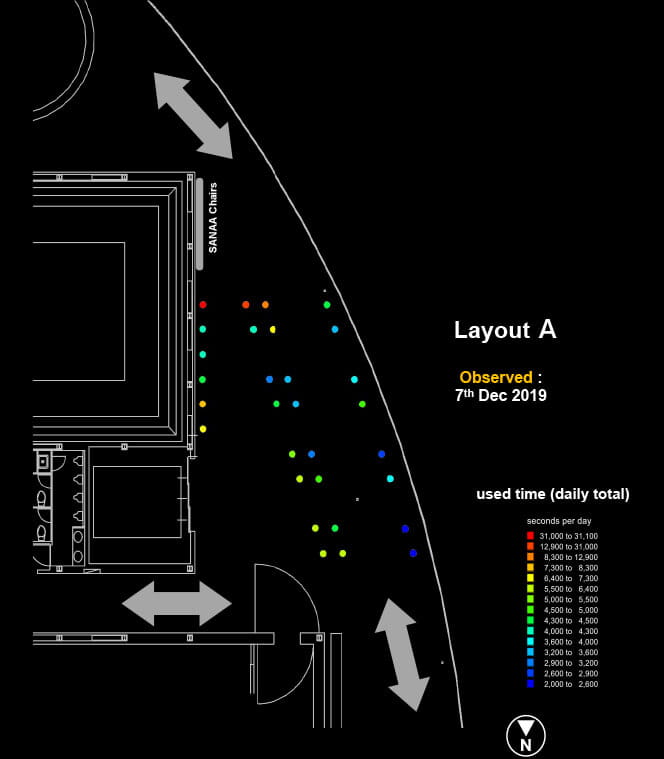
For comparison, we can look at the data for another day (7th Dec) with the same layout.
Again, the stools in the southern part of the space were used most frequently.
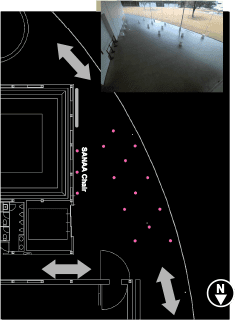
How about Layout B?
The distances between stools were widened, but the overall pattern of use is similar to that of Layout A, with the southern part by the wall being used for longer.

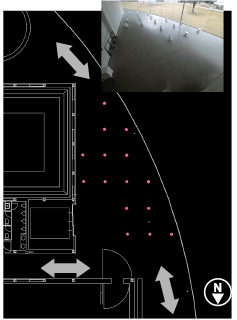
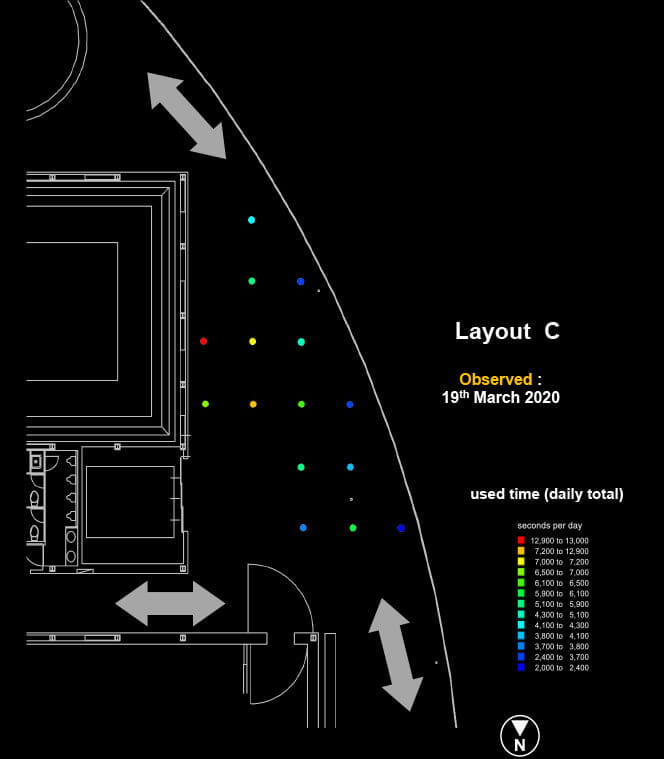
Finally, Layout C.
In this layout, the SANNA design chairs were removed, but again, the stool by the wall in the southern part of the space saw the highest usage.
Let’s consider the reasons behind these distribution differences from a Space Syntax point of view.

1.To investigate the possibility of using video analysis technology to understand human behaviour in public spaces
Technology features
Advantages
- Data can be collected automatically without observers.
It can be installed anywhere a video camera can be installed. - Possible to understand quantitative shift.
It is easy to obtain movement flow data to see usage patterns. - Any unexpected phenomenon can also be recorded.
It is possible to see the data before and after big rises and drops in activity. - Possible to change the analytic methods in a flexible way.
By revising the program, data can be summarised in different ways.
Disadvantages
- Fine adjustment is required when the system is installed.
Accuracy varies depending on the installation location and angle of view. - The data obtained is too "big“.
It's difficult simply to handle the data in the first place. - Difficult to collect "qualitative" data, .i.e. detailed actions.
New technologies such as facial expression analysis are emerging, but it is still difficult to interpret the meaning of subtle behaviours. - Overall, it tends to be more time-consuming than the "classic" way of observing.
Field observation is simple in the sense that the data collected is limited.
Possible use
- Useful for simple "counts" and an overall "quantitative" understanding of movement patterns.
→ Since data can be obtained automatically over a long period of time, this method appears to be suitable for generating a quantitative understanding of behaviour trends. - Difficult to grasp the "qualitative" characteristics of subtle activities.
→ As technologies for recognising facial expressions and whole body movements are beginning to appear, it is likely that some of them will usable for these purposes in the future.
2.To understand the variations in use patterns according to different layout patterns and stool positions
Overview of results
- Usage rate is influenced by the flow line, the relationship with walls, windows, other stools, and so on.
→ First, it was found that people are more likely to move along routes with higher integration values.
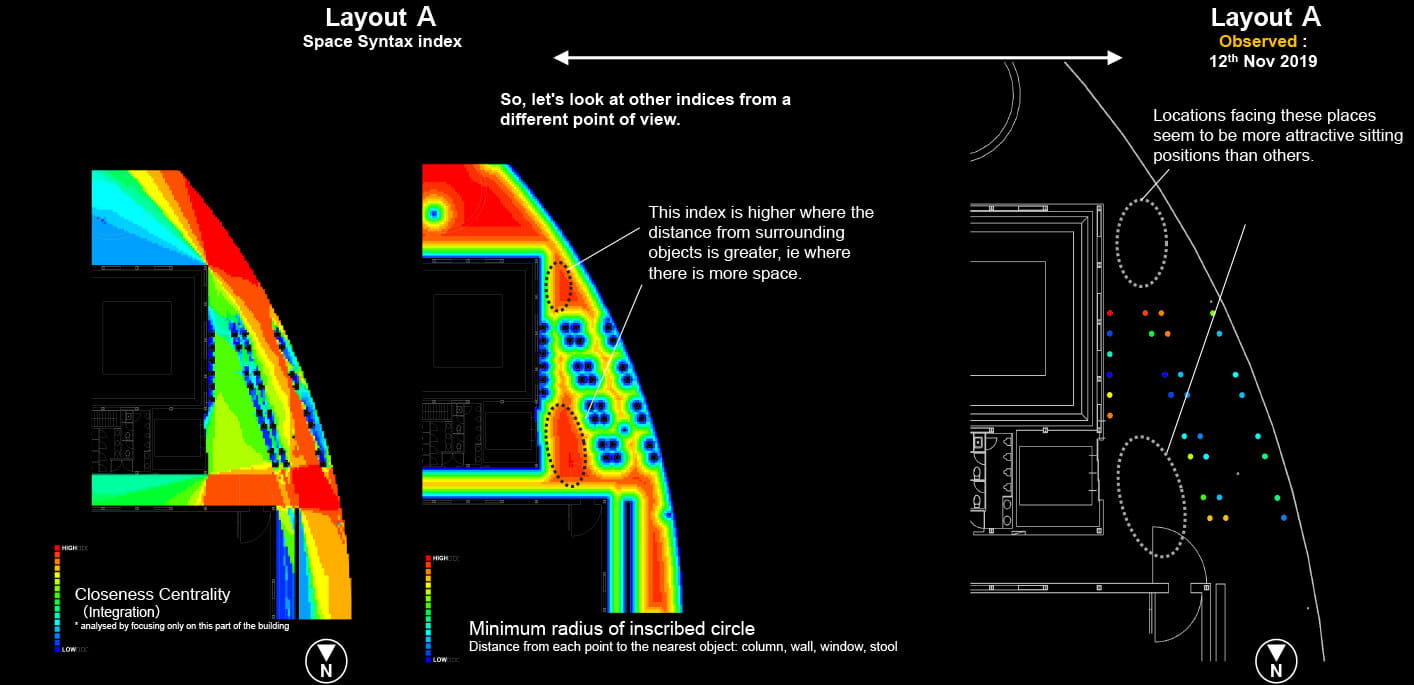
→ On the other hand, the choice of a stool seems to depend on its relationship with surrounding objects ie how well spaced away it is from other people and objects.
Consideration / further development
- The data show that stools are used differently depending on their layout and position.
→ With this method, we were able to obtain data on the usage time of each stool across 5-minute time periods. The visualised data clearly showed that the usage time for each position differs depending on its spatial layout. - Relationship between Space Syntax indexes and movement pattern/sitting locations.
→ correlation between movement pattern and Space Syntax indexes has been demonstrated. Using these findings, we started to consider seating positions using spatial indicators. Sufficient statistical analysis has not yet been undertaken, but we believe that understanding the differences as patterns is the first step in evidence-based design discussions. In this way, Space Syntax aims for an approach that stimulates thinking and discussion, and does not rely solely on the intuition of the designer - nor is it an approach that is overly rigorous or routinised. - Further development is needed to use as an evaluation tool for layouts.
→ To clarify whether the findings obtained in this study are universal to all buildings or applicable only to museums (or only even to this museum), it will be necessary to conduct further surveys in other museums and public spaces. Furthermore, an ongoing process of research is required that would use the knowledge generated in this experiment to develop "better" layouts, predict their likely impacts, then see whether, once installed, they work as expected. We hope that someday, somewhere, we can continue this experimental approach of testing, analysis, conjecture and discussion.